Curated OER
Chairs Around the Table
Youngsters become flexible problem solvers with this challenging lesson. If there are 24 square tables in a restaurant, how many customers can be seated at one time? They can use manipulatives or draw pictures to help them find the...
EngageNY
Calculating Probabilities of Events Using Two-Way Tables
Tables are useful for more than just eating. Learners use tables to organize data and calculate probabilities and conditional probabilities.
EngageNY
Tables of Equivalent Ratios
Don't table the discussion on equivalent ratios — do it now! Scholars create tables of equivalent ratios to represent contextual problems. Pupils go on to use the tables to answer questions within the context. The instructional activity...
Merck KGaA (Darmstadt, Germany)
EMD PTE
You can't tell by the title, but this is a functional periodic table of elements. Incorporating bright colors, lucid text, and easily operated features, this application serves as a valuable reference tool for your chemistry class.
EngageNY
From Ratio Tables to Double Number Line Diagrams
How much sugar is in one bottle? Pupils use double number line diagrams to determine the amount of sugar in a 1L bottle of cola. The teacher leads a discussion on ways that double number lines can be of assistance in solving a...
5280 Math
Multiplication Table Algebra
Patterns, patterns, everywhere! Young scholars examine the multiplication table to identify patterns. Their exploration leads to an understanding of the difference of squares and sum of cubes by the completion of the algebra project.
Inside Mathematics
Conference Tables
Pupils analyze a pattern of conference tables to determine the number of tables needed and the number of people that can be seated for a given size. Individuals develop general formulas for the two growing number patterns and...
IXL Learning
Small Times Table Reference Charts
Support young mathematicians on their journey to fluent multiplication with these handy reference tables. Small enough to fit in their pockets, these charts allow children to practice their multiplication facts anywhere they go.
EngageNY
Summarizing Bivariate Categorical Data with Relative Frequencies
It is hard to determine whether there is a relationship with the categorical data, because the numbers are so different. Working with a familiar two-way table on super powers, the class determines relative frequencies for each...
EngageNY
Summarizing Bivariate Categorical Data
How do you summarize data that cannot be averaged? Using an exploratory method, learners complete a two-way frequency table on super powers. The subject matter builds upon 8th grade knowledge of two-way tables.
Curated OER
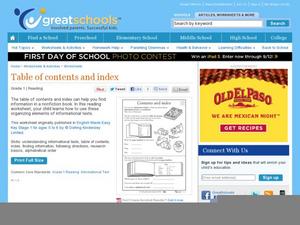
Contents and Index
It's important for your readers to understand features of informational text such as index and table of contents, so give them this visual activity to get started. They read a brief explanation of informational text, then look at an...
Curated OER
Food chains at sea
Fifth graders interpret a table of data about food chains in the ocean. They create a food chain to represent the information on the table. Periwinkles eat seaweed, and crabs eat periwinkles - so who eats crabs? Extend the activity with...
Curated OER
Extending the Definitions of Exponents, Variation 2
Introduce the concept of exponential functions with an activity that extends the definition of exponents to include rational values. Start with a doubling function at integer values of time, then expand table to include frational time...
Curated OER
Unstable Table
Bothered by a wobbly table? Learn how to fix this problem using concepts of slope and continuity. Pupils first consider the problem in two dimensions and then progress to three dimensions. The solution is really quite simple.
DK Publishing
Multiplying and Dividing by 10, Part 3 - Using the 10 Times Table
Challenge your third graders on the 10 times tables. Given three numbers at the top of each table, learners fill in the missing numbers to complete three more multiplication and division problems. This resource is a great way to extend...
DK Publishing
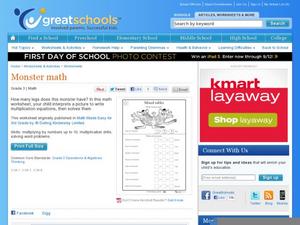
Monster Math - Mixed Tables
How many buttons would there be on six monsters? Multiplication beginners examine a strange-looking creature as they write eight number sentences. For each, they are determining how many of a particular feature would be on a specific...
Curated OER
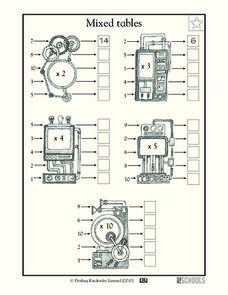
Mixed Tables
Who knows how to operate these multiplication machines? Young mathematicians examine five machines, each with a specific function (i.e. x3) to transform the input numbers to output numbers. They send five numbers through each machine,...
EngageNY
Comparing Rational Expressions
Introduce a new type of function through discovery. Math learners build an understanding of rational expressions by creating tables and graphing the result.
Curated OER
Mixed Tables
These dinosaurs act like math machines as scholars practice their division skills. Each one has a given division function to apply to four incoming dividends. Pupils complete the equations, writing in the quotient for each. There...
Mathematics Vision Project
Module 8: Modeling Data
Statistics come front and center in this unit all about analyzing discrete data. Real-world situations yield data sets that the class then uses to tease out connections and conclusions. Beginning with the basic histogram and...
Curated OER
Investigation - Mathematical Reasoning: Tables and Chairs
Fourth graders draw pictures and diagrams as they attempt to solve a mathematical problem involving the arrangement of eleven tables shaped like equilateral triangles and the seating of exactly twenty-five people.
Curated OER
Conversions: Capacity
Practice converting units of measurement and reading data from a table. Young learners study a conversion table at the top of the page, and use the information about converting units of capacity (ounces, cups, quarts, etc.) to solve the...
Curated OER
A Sum of Functions
Collaborative learners will see the geometric addition of functions by graphing the sum of two graphed curves on the same coordinate plane. This task then naturally flows into giving learners the algebraic representation of the curves...
Curated OER
"Comprehension of Word Problems" Using a Table
Sixth graders practice solving math problems by utilizing a data table. In this number sense lesson, 6th graders create a table using the numerical information about a fictitious farm's inventory. Students complete the empty segments by...


