Curated OER
Nutrition Labels - Fats in your Diet
Students analyze the American diet and the amount of fat content that we choose to include in our food. Eating habits are monitored and results compared to the recommended amounts.
Curated OER
Skittle Graphing (Lesson Plan)
Students discuss the uses of graphs. They use color candies to count and sort before designing graphs. They label the graph papers with appropriate titles and candy colors. They complete the graph bars, and discuss the results with a...
Curated OER
Getting There
Pupils practice reading a pictograph. In this data analysis instructional activity, students collect data and create their own pictograph. A pupils worksheet is included.
Curated OER
Kansas Foods A Data and Probability Investigation
Students study a number of food products and anticipate which are derived from Kansas crops. They make a list of words associated with the food stuffs and graph the results.
Curated OER
Genetically Modified Foods
Learners explain what genetically modified foods are and how they are created. Students use appropriate vocabulary to describe and effectively discuss the benefits of, and potential risks of, genetically modified foods.
Curated OER
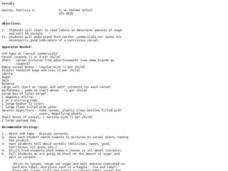
Cereals
Young scholars watch television commercials, then analyze the nutritional value of the cereals. In this health and nutrition instructional activity, the teacher shows students several cereal commercials, then the young scholars describe...
Curated OER
Pyramid Panic Lesson
Students research human health by identifying fatty and sugary foods. In this food choices lesson, students discuss the five food groups and examine the healthiest choices from each group. Students utilize the web to complete a health...
Curated OER
Stats on Reduced-Fat
Middle schoolers demonstrate an understanding of the Five-Number Summary and Box-Plots after analyzing data from nutrition labels, forming a hypothesis and supporting it. They decide if there is a significant difference between reduced...
Curated OER
Sense of Taste
Young scholars swab different sections of the tongue to identify taste buds. In this sense of taste lesson, students make predictions and conduct an experiment. Young scholars experiment with a variety of flavors and discuss...
Curated OER
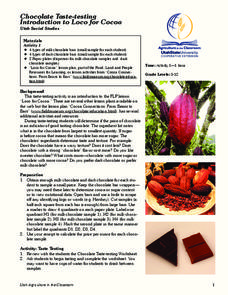
Chocolate Taste-Testing: Introduction to Loco for Cocoa
Students compare chocolates using their five senses and determine the value of the chocolate. In this chocolate lesson, students sample various types of chocolate. Students study the price per ounce of each bar to complete the...
Curated OER
Iron For Breakfast
Third graders are challenged to use scientific thinking, they experiment and observe which objects are attracted to a magnet. Pupils use the evidence to construct an explanation as to what common property the objects attracted to a...
Serendip
Using Models to Understand Cellular Respiration
Energize biologists with colorful images in an activity that captivates the imagination while demystifying the subject of cellular respiration. Participants build comprehension skills and access core content knowledge by analyzing text...
Nuffield Foundation
Investigating the Effects of Biochar on Soil Fertility
Breathe some new life into charcoal. Scholars use biochar to improve soil fertility. They test the effectiveness of this addition by conducting an experiment with soil having 0%, 2%, and 4% biochar.
Science Matters
Ring of Fire
Over a period of 35 years, earthquakes and volcanoes combined only accounted for 1.5 percent of the deaths from natural disasters in the United States. The 15th lesson in a 20-part series connects the locations of earthquakes and...
Curated OER
Awesome Animals
Young scholars collect data from classmates about their favorite animal. They use the ClarisWorks graphing program to enter data, graph results, and interpret data.
Curated OER
Chart/Graph
Students create a class survey, place the data in a spreadsheet and graph the information.
Curated OER
Plant Seedling
Students label seed parts and plant seeds. In this seeds lesson plan, students observe and learn about how seeds play a huge role in all plants and food.
Curated OER
Food Classification
Students are introduced to classification and some of the difficulties surrounding classification and how classification systems need to be able to adapt and how they may need to be changed when new information is discovered. They...
Curated OER
Restaurants and Institutional Examination 4
Match the vocabulary terms in column A with the definitions in column B. Write the letter of the definition in column B in the space next to the terms in column A.Write short answers or fill in the blank to the following questions and...
Curated OER
Yaba "Data" Cereal
Fifth graders create and modify a database using information from cereal labels.
Curated OER
Seed to Plant
Students understand the stages of a plants life. In this stages of plant development lesson, students read about bean plants and grow their own. Students record growth and photograph changes in their plants. Students label the parts of a...
Curated OER
Survey Says...
Young learners create and implement a school-wide survey about student body favorites! Learners record and analyze the data on a bar graph, picture graph, and line graph, and then display the data. Then, wrap it all up with a celebration...
Curated OER
Visual Representation of Reduced Fat
Students demonstrate their understanding of the Five-Number Summary and Box-Plots by analyzing different nutrition labels from regular and reduced fat items using graphing calculators.


