Curated OER
Narnia Bar Charts
Here is a fabulous presentation that combines math and literature. Learners construct bar charts and frequency charts about things that happen in Narnia. Student pairs are assigned tasks regarding the variety of characters found in the...
Teacher's Corner
Favorite Dr. Seuss Book Graph
What's your class' favorite Dr. Seuss book? Find out using this book graph that lists nine different titles and asks participants to indicate their favorite. Results are then tallied and graphed.
Curated OER
Going Graph-y
Second graders listen to and dicuss the story Where the Wild Things Are. They play a pantomime game and act out various feelings so their classmates can guess. They listen for the frequency of certain words, and record their findings on...
Curated OER
Complete the Graphs
First, second, and third graders make pictographs. There are four graphs to complete, and the answer sheet is included. Consider providing your learners with special needs two sets of stickers to use, instead of requiring them to draw...
Curated OER
Picture Graphs
An innovative way to practice reading data, as well as the four operations! Three picture graphs prompt first graders to count marbles, books, and pets. They also solve addition and subtraction problems. Additionally, they work on...
EngageNY
Interpreting, Integrating, and Sharing Information: Using Charts and Graphs about DDT
Is American growing fatter? Scholars begin with a mini lesson on reading charts and graphs using information about Human Body Fat in United States. They then transfer what they learned to charts and graphs using harmful and...
K12 Reader
Showing Data on a Graph
Here's a instructional activity that not only introduces kids to graphing, but also is designed as a reading comprehension activity. After reading the article about graphing, kids respond to a series of questions based on the article.
Curated OER
Twenty-Seven Graphing Lines, Parabolas, and Absolute Value Problems
Have learners find coordinates of point on a graph, find equations of graphs given, and graph given equations using in and out tables. There are 27 problems related to equations for lines, parabolas, and absolute value functions.
Curated OER
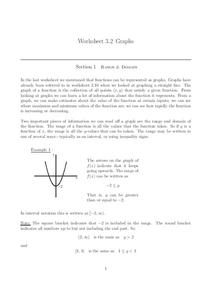
Graphs
In this graphs worksheet, students solve and complete 15 various types of problems. First, they determine the range of the function of the graph shown and write in interval notation. Then, students find the domain of the function in the...
Worksheet Place
How I Get to School
Find out how many of your learners take the bus, how many walk, and how many bike with a quick survey. Class members gather data about how each individual gets to school and mark the results on this page in order to create a bar graph.
Curated OER
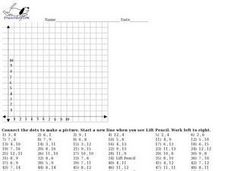
Graph Picture (Coordinate Pairs)
Coordinate graphing on a grid is the focus of this worksheet. Young mathematicians plot 42 coordinate pairs on a graphing grid, then connect the dots to make a picture. A fun way to get your learners involved in graphing!
Curated OER
Graph a Picture on Cartesian Coordinates
Find out what picture is hidden in this graph and work on coordinate graphing with this instructional activity! Learners plot 66 ordered pair points on a Cartesian graph, then connect the dots to make a picture. This would work as an...
Curated OER
Graph Picture (Coordinate Pairs) 2
Looking for an engaging way to encourage your class to practice graphing coordinate pairs? This might be the activity you are looking for! For this instructional activity, learners create a picture by plotting 54 coordinate pairs on...
Curated OER
Graph Picture (Coordinate Pairs) 3
Here is a very good coordinate graphing learning exercise. Learners practice graphing by plotting 58 coordinate pairs, then connecting the dots to reveal a picture. This resource could be used as an in-class activity or a homework...
Curated OER
Math--Pictures and Bars--Learning About Graphs
What is a graph? What does it tell us? How do you make one? These are all questions that are answered in the included packet. It's a great introduction to graphing for young learners!
Curated OER
Best-Selling Books Bar Graph
Students fill in bar graphs to show ten of the best-selling students' books of all time. Students create simple bar graphs to show how many copies of each of the ten books have been sold.
Teacherfiles
Plot Graph
Any story can be mapped onto a plot graph. This particular chart includes the mountain shape of a traditional plot graph. Each element of plot is labeled on the page and surrounded by a box to make the words stand out. Learners write in...
Curated OER
Graphing
Students collect data to create different types of graphs-line, pie, and bar graphs. They use StarOffice 6.0 to create graphs.
Curated OER
Color Graphs and Poetry
Students explore color as they create graphs, write poetry, and examine varied interior designs. They respond to writing prompts describing their favorite color. Students collect data and create a bar graph based on a class survey. They...
Curated OER
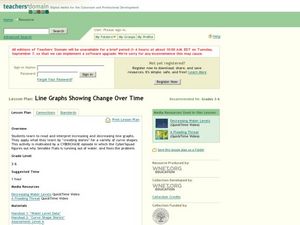
Line Graphs Showing Change Over Time
Students analyze line graphs. In this graphing lesson, students analyze line graphs paying attention to how the data changes over time. This lesson includes two video clips, one demonstrating an increasing line graph and one...
Florida Center for Reading Research
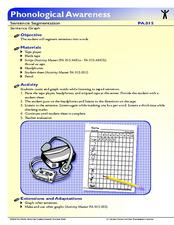
Phonological Awareness: Sentence Segmentation, Sentence Graph
Young scholars segment sentences while they listen to a series of sentences. Using a graph, pupils make a mark for each word they hear. Learners listen to each sentence three times; once to listen, once to mark, and once to check their...
Baylor College
Air: The Math Link
Inflate this unit on the science of air with these math skills practice and word problems. Accompanying the children's story Mr. Slaptail's Secret, this resource covers a wide range of math topics including the four basic...
Curated OER
Rockefeller's Revenge: Exxon and Mobil Unite
Study the impact and possible outcomes of the Exxon-Mobil merger in your language arts, social studies, or economics class. Secondary learners evaluate a series of graphs, write a paragraph interpreting the data, and engage in class...
Federal Reserve Bank
Less Than Zero
Perry the penguin wants to buy a new scooter, but he doesn't have any funds! Walk your kids through the short book Less Than Zero, and have them track his borrowing, spending, and saving on a line graph while you read. Pupils will learn...
Other popular searches
- Coordinate Graphing Pictures
- Charts and Graphs
- Graphic
- Graphic Organizers
- Graphing Ordered Pairs
- Bar Graphs
- Circle Graph
- Vertex Edge Graph
- Graphing Skills Lesson Plans
- Graphic Design
- Line Graphs
- Double Bar Graph


