CPO Science
Physics Skill and Practice Worksheets
Stop wasting energy searching for physics resources, this comprehensive collection of worksheets has you covered. Starting with introductions to the scientific method, dimensional analysis, and graphing data, these skills practice...
Curated OER
M&M Science and Math
A series of math and science activities feature M&M's® as manipulatives to help kids work through equations. The resource includes exercises on finding averages, percent of compositions, moles in chemical reactions, genotypes and...
Towson University
Looking Backwards, Looking Forward
How do scientists know what Earth's climate was like millions of years ago? Young environmental scholars discover how researchers used proxy data to determine the conditions present before written record. Grouped pupils gain experience...
Towson University
The Crucial Concentration
Which sports drink provides the best pick-me-up after the big game or grueling workout? It may not be the one you'd think! Food science is the focus in a surprising lab activity. Pupils use colorimetry to determine the amount of protein,...
Curated OER
Tides at the Battery, NY
Skill in using Excel and increasing proficiency in manipulating data are challenged with this data analysis work. A web link supplies data and step-by-step instructions help learners create a graph. There are many extension...
University of Georgia
Heating and Cooling of Land Forms
Compare heating and cooling rates of different land forms. A lab activity has groups collect data on the rate of heating and cooling of soil, grass, saltwater, fresh water, and sand. An analysis of the rates shows how the different land...
Towson University
It's a Gassy World!
How much does your class know about the relationship between climate change and carbon dioxide? Science scholars explore the nature of greenhouse gases and rising ocean temperature through demonstrations, research, and experiments. The...
Center for Learning in Action
Density
Explore the concept of density within states of matter—gases, liquids, and solids—through a group experiment in which young scientists test objects' texture, color, weight, size, and ability to sink or float.
University of Georgia
Energy Content of Foods
Why do athletes load up on carbohydrates the evening before a competition? The lesson helps answer this question as it relates the type of food to the amount of energy it contains. After a discussion, scholars perform an experiment...
Curated OER
Food chains at sea
Fifth graders interpret a table of data about food chains in the ocean. They create a food chain to represent the information on the table. Periwinkles eat seaweed, and crabs eat periwinkles - so who eats crabs? Extend the activity with...
Berkshire Museum
Reduce, Reuse, and Recycle: Sorting Through Personal Choices
Raise children's awareness about the importance of conservation with this hands-on science activity. Start by breaking the class into groups and having them collect trash from around the school or local park. Learners then use the...
Curated OER
Graphing Data Chart
In this fish data worksheet, students complete a graphic organizer by writing in the maximum length and maximum weight for 13 different fish.
Curated OER
Think Science - Collecting Data
In this data collection worksheet, students collect data about butterflies and milkweed plants and record the measurement tools they use to collect it. Students complete 2 columns.
NASA
Newton Car
If a car gets heavier, it goes farther? By running an activity several times, teams experience Newton's Second Law of Motion. The teams vary the amount of weight they catapult off a wooden block car and record the distance the...
Teach Engineering
Concentrating on the Sun with PVs
Concentrate to determine the best reflector design. Pairs use the engineering design process to build a reflector to increase the current output of a photovotaic panel. Teams arrive at a final design and present it to the class along...
Curated OER
Weather Conditions
In this weather conditions worksheet, students use a month of recorded weather conditions to create a graph comparing the number of days it was cloudy, raining, or clear. This worksheet has a graphic organizer and a graph.
Curated OER
Weathering Lab
Assist your middle school class with one of the most inclusive weathering and erosion labs available. Individuals use sugar cubes and alka-seltzer to demonstrate the process of physical and chemical weathering. They sketch results...
abcteach
Community Walk
Invite your pupils to explore their surroundings with a walk around the neighborhood. Learners use their senses to make observations about their surroundings.
Curated OER
Weather Instrument Data Chart 2
In this science worksheet, students look for the data that is needed to fill in the graphic organizer. The prefixes are given that are needed to sort the information as it is collected.
Curated OER
Too Much Oxygen or Too Little?
In this oxygen instructional activity, students analyze date about the oxygen levels in a river to determine the cause of the dying fish. This instructional activity has 2 graphs, 12 short answer questions, and 2 graphic organizers.
Curated OER
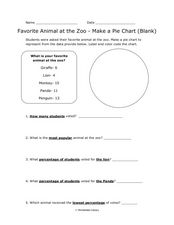
Pie Chart: Favorite Animal at the Zoo
In these three interpreting a pie chart and answering questions worksheets, students use the data provided to label and color code the blank and outlined pie charts, read and interpret a completed pie chart, and then answer questions...
Curated OER
Venn Diagrams - Brown Hair & Blond Hair
In this comparison graph worksheet, students complete a Venn Diagram for the children in their classroom. Students total the number of kids who have blonde hair and brown hair.
Curated OER
Gender and Eye Color Venn Diagram
In this Venn Diagram learning exercise, students complete comparison graph for gender and eye color. Students use the students in their class for the data.


