Curated OER
Physical Science: Festival of Bubbles
Investigate bubbles through the use of scientific inquiry. Pupils blow bubbles using several methods and measure the resulting bubble print. Measurements are recorded on a data table and transferred to a bar graph. Results are discussed...
Math Worksheets Land
Pie or Circle Graphs Problems - Independent Practice Worksheet
Third graders take a set of data and turn it into a pie graph with an independent worksheet. Containing 10 sets of data, the resource reinforced data analysis skills that pupils can use throughout a graphing unit.
Learning Games Lab
Scientific Graph Reading
Interpreting graphs is an essential skill for young scientists. An interactive online lesson gives individuals an opportunity to review the components of a graph and learn to read and interpret the shape of a graph. The lesson includes...
Kenan Fellows
Reading Airline Maintenance Graphs
Airline mechanics must be precise, or the consequences could be deadly. Their target ranges alter with changes in temperature and pressure. When preparing an airplane for flight, you must read a maintenance graph. The second lesson of...
InqueryPhysics
Interpreting Motion Graphs
Every movement in the world can be measured and even motionless objects can be significant indicators of movement. Focus on motion graphs that feature distance vs. time, speed vs. time, and positive and negative acceleration.
Curated OER
Graphing Canada
Students research a province of Canada choosing a question to investigate. They record their information on a worksheet that is provided and complete a graph. They present their bar graphs to the class.
World Wildlife Fund
Bar Charts & Pie Charts
Learn about life in the Arctic while practicing how to graph and interpret data with this interdisciplinary instructional activity. Starting with a whole group data-gathering exercise, students are then given a worksheet on which they...
Illustrative Mathematics
Weather Graph Data
Teaching young mathematicians about collecting and analyzing data allows for a variety of fun and engaging activities. Here, children observe the weather every day for a month, recording their observations in the form of a bar graph....
Science 4 Inquiry
Snakes in the Everglades
The Burmese python is on the loose ... and he's hungry! Illustrate the differences between causative and correlative relationships through an inquiry instructional activity. Pupils examine several sources of information to determine if...
NASA
Geographical Influences
"If global warming is real, why is it so cold?" Distinguishing the difference between weather and climate is important when it comes to understanding our planet. In these activities, young scientists look at the climate patterns in a...
Las Cumbres Observatory
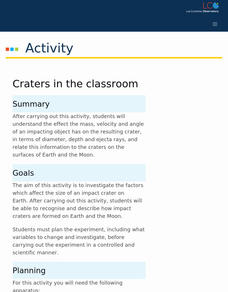
Craters in the Classroom
Laws of motion apply both in space and on Earth. Young experimenters model object impact on the Earth and moon. They use data to determine the effect mass and velocity have on the resulting craters and how that relates to the energy of...
Curated OER
Solar Heating in the Himalayas
A fascinating instructional activity on how solar power is utilized by people who live in the Himalayas is here for you. In it, learners perform a case study which will help them understand that solar energy is a renewable resource, that...
Curated OER
Air Pollution in Mexico City
A fantastic instructional activity on urban air pollution problems throughout the world is here for you. Learners understand that there are many factors involved in creating pollution, that there are many health effects brought on by air...
Columbus City Schools
Speed Racers
Who wants to go fast? The answer? Your sixth-grade science superstars! The complete resource offers the ultimate, all-inclusive playbook for mastering the important concepts of speed versus time; distance versus time; and how to graph...
Edmond Public Schools
8th Grade Science Resource Book: Unit 2 - Physics
Get things moving with this extensive collection of physical science resources. Covering the fundamentals of measurement, graphing, lab safety, and experimental design as well as the specific scientific concepts of velocity,...
Learning Games Lab
The Magic of Reading Graphs
Making conclusions from graphs doesn't need to seem like magic. Learners explore an interactive lesson on reading graphs to strengthen their skills. The content discusses how to read the axes of a graph and draw conclusions based on the...
National Security Agency
Line Plots: Frogs in Flight
Have a hopping good time teaching your class how to collect and graph data with this fun activity-based instructional activity series. Using the provided data taken from a frog jumping contest, children first work together creating a...
Teach Engineering
Air Pollution in the Pacific Northwest
Scholars investigate levels of nitrogen dioxide in the Pacific Northwest by examining the role of nitrogen in air pollution and how remote sensing can be used to measure nitrogen levels. An Excel spreadsheet calculates the difference...
NOAA
Graphing Temperatures
Battle of the hemispheres? In the fourth installment of a five-part series, young oceanographers use the NOAA website to collect temperature data from drifters (buoys), one in the Northern Hemisphere and one in the Southern Hemisphere....
Chymist
The Solubility of a Salt in Water at Various Temperatures
An educational lesson allows young chemists to test the solubility of different types of salt at various temperatures. Groups create a graph using data from unsaturated, saturated, and supersaturated solutions.
Kenan Fellows
Determining the Atomic Mass of Elements in a Compound Using Matrices
Scholars apply concepts learned in both Algebra II and Chemistry to answer the questions on the provided worksheet. The activity allows for extra practice in both classes and helps connect concepts usually taught in isolation. The...
Polar Trec
Do Microorganisms Live in Antarctica?
Can microorganisms live in the dry, cold climate of Antarctica? Young scientists view a research project measuring microorganisms in the Taylor Glacier. They record the findings from dirty ice, clean ice, boots, sediment, and more. Then...
Curated OER
Olympic Bar Graphs
In this Olympic bar graph worksheet, students pick a sport from the 2004 Olympic games and find data from the Olympic web page. They graph the scores (times, distance, or speed) and the medals. They answer questions about the variables...
Curated OER
3 Kinds of Graphs
Students construct three different graphs-a line graph, a bar graph, and a circle graph. In this graphing instructional activity, students use different graphs to display various data that they collect.


