Curated OER
Worksheet 29
In this math worksheet, learners investigate how time is related to the concept of increasing or decreasing velocity. Then they consider times and answer the questions of whether the velocity is changing.
Curated OER
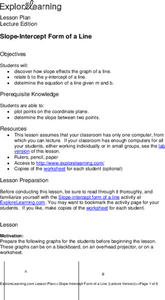
Slope-Intercept Form of a Line
Students determine how the slope affects the graph of a line. They relate "b" to the "y"-intercept of a line and solve the equation of a line given "m" and "b." They are given scenarios and possible answers to which they explain why or...
Curated OER
Don't Crack Humpty
Students investigate the engineering design process and the relationship between distance, time, and speed. Using a generic car base, small groups design a device that will protect an egg on or in the car as it is rolled down a ramp at...
Curated OER
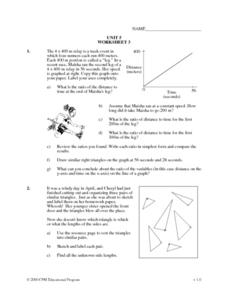
Unit 5: Worksheet 3 - Similar Triangles
In this similar triangles worksheet, students use proportions to solve for the missing sides of similar triangles. This two-page worksheet contains 16 multi-step problems.
Illustrative Mathematics
Robot Races
Analyze data on a graph to answer three questions after a robot race. Learners practice comparing ratios and reading points on a graph. Answers may vary on the last question based on accuracy of graphing. Use the lesson along with...
Curated OER
Vectors: How Much Force Can You Apply
This lesson entails the viewing of two videos to get an overview of force and its application. The lesson covers how vectors use force in real-world situations.
Curated OER
Graphing Your Motion
Seventh graders investigate velocity and speed. For this Vernier Probe lesson, 7th graders will use probes to calculate motion, speed, and velocity of an object. They will create a graph of their collected data.
Curated OER
Time Trials
Learners investigate speed, time and distance. In this algebra lesson, students utilize their knowledge of linear equations to solve problems related to time, speed and distance. This assignment is hands on using two toy race cars.
Curated OER
It's About Time
Young scholars investigate how Global Positioning Systems work and how and why GPS receivers make errors. They graph data points and apply estimation and prediction to real-life GPS situations, discuss time delay, and complete a worksheet.
Curated OER
Go, Speed Reader, Go
Students increase their reading fluency through the use of various strategies. After reviewing chunking, decoding, and rereading, students complete an initial read of a novel text. Working in small groups, they read complete a timed...
Curated OER
Relating Graphs to Events
In this algebra worksheet, students identify the graph that goes with-the equation. They solve word problems using graphs. There are 4 problems with an answer key.
Curated OER
Domino Dash
In this speed worksheet, students use dominoes to measure the average speed of rows falling over. Students make a line graph to show the relationship between the length of the domino row and the time. Students answer 8 questions about...
Curated OER
Take a Walk
Sixth graders graph acceleration and practice using the metric system. In this physics lesson, 6th graders take turns timing each other as they walk 15 meters. Students then chart and graph their data using the metric system.
National Council of Teachers of Mathematics
Varying Motion
For this secondary mathematics learning exercise, high schoolers collect data based on a person’s motion. From this data, learners create graphs comparing displacement, velocity, and acceleration to time. The five-page learning exercise...
Curated OER
Roots of the Mariana Arc
Plumb the depths of the Submarine Ring of Fire and explore seismic waves with this lesson. Junior geologists simulate s-waves and p-waves, calculate their speeds, and then apply the data to discover the material that makes up inner...
Curated OER
Slope-Intercept Form of a Line
Using the subscriber website Explorelearning.com, young mathematicians observe changes in the slope and y-intercept and their effect on the graph of lines. This activity helps learners develop an intuitive sense of the connection between...
Curated OER
Describing the Motion of a Battery Powered Cars
Young scholars explore distance a toy car travels by changing the amount of batteries used to power the toy car. In this force and motion lesson, students calculate the average speed of a car while investigating the power from...
Curated OER
Investigating Motion, Forces, and Energy Lab Book
Eighth graders create their own experiements using toy trucks, cars or balls to measure the time it takes two of them to travel 5 meters, as well as at each 1 meter interval. They make use computers to make a time/distance graph and...
Illustrative Mathematics
Walk-a-thon 2
During a walk-a-thon your learners must determine the walking rate of Julianna's progress. Using tables, graphs, and an equation, they must be able to calculate the time it took her to walk one mile and predict her distance based on the...
Curated OER
Dragonfly
The speed of a dragonfly brings math into the real world as your learners collaboratively see the value in calculating unit rates in direct proportion problems. This six-phase lesson encourages you, as the teacher, to only ask questions...
Noyce Foundation
Truffles
Knowing how to scale a recipe is an important skill. Young mathematicians determine the amount of ingredients they need to make a certain number of truffles when given a recipe. They determine a relationship between ingredients given a...
Curated OER
Reading Fluency
Aid readers in achieving fluency! Hone in on appropriate pacing, accurate pronunciation, and varied intonation through modeling and ample practice. In one-minute bursts, individuals rehearse reading a passage aloud, recording where...
Illustrative Mathematics
Writing Constraints
Use this resource to present your number crunchers with how to write a constraint equation and to determine viable solutions. The price of an object limits the amount that can be purchased. The speed at which you walk limits the number...
NASA
Measuring Dark Energy
You're only 10 minutes late? Do you know how much the universe has expanded in those 10 minutes? Scholars graph supernovae based on their redshift and see if the results verify Hubble's Law. If it does confirm it, the universe is...

