Curated OER
Mapping the Ocean Floor
Students study the bottom structure of underwater habitats and how they can be mapped.
Virginia Department of Education
Functions 1
Scholars learn what it means for a relation to be a function and see various representations of functions. After learning the definition, they participate in a card sorting activity classifying relations as functions or not.
Curated OER
How Far Did They Go?
Students create a map. In this direction and distance instructional activity, students come up with familiar places in the community and calculate the distances from these places to the school. Students create a map that displays these...
Curated OER
Lobster Business Charts
Learners research four Maine based businesses involved with lobster fishery as a career analysis. In this career exploration instructional activity, students research lobster fishery businesses and write a class book showing the...
Curated OER
A World of Information
Students analyze data and statistics about countries around the world. They read graphs and charts, color a world map to illustrate the top ten statistics about the world, and write a paragraph to summarize their information.
Curated OER
Arkansas is Our State: Differentiating Between a State and a Country
An ambitious geography lesson is geared toward kindergartners. They discover what the differences are between states and countries. They look at maps of Arkansas, and learn what the shapes and lines mean. Additionally, they create a...
Curated OER
Air Pollution in Mexico City
A fantastic lesson on urban air pollution problems throughout the world is here for you. Learners understand that there are many factors involved in creating pollution, that there are many health effects brought on by air pollution, and...
Moanalua Gardens Foundation
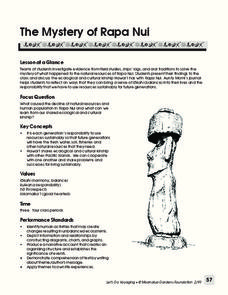
The Mystery of Rapa Nui
What caused the collapse of the environment on Rapa Nui (Easter Island)? Who constructed the Moai? What was their purpose? Class members assume the role of investigators and use evidence drawn from field studies, ships' logs, and...
National Museum of Nuclear Science & History
Alphas, Betas and Gammas Oh, My!
Referring to the periodic table of elements, nuclear physics learners determine the resulting elements of alpha and beta decay. Answers are given in atomic notation, showing the atomic symbol, mass, atomic number, and emission particles....
Curated OER
Exploring an Atlas
Students explore global geography by participating in an atlas activity. In this countries of the world lesson, students collaborate in small groups and analyze an atlas while researching continents, countries and demographics. Students...
Curated OER
Where is the Trail? The Journey of Lewis and Clark
Students explore the trail followed by Lewis and Clark on their journey across the United States. In this United States History lesson, students complete several activities to establish the Lewis and Clark Expedition, including a class...
Curated OER
Hopes and Dreams: A Spreadsheet Lesson Using Excel
Fourth graders read "The Far Away Drawer" by Harriet Diller and discuss the story as a class. After discussion, 4th graders create a t-shirt GLYPH about their hopes and dreams,share their information with the class and create spreadsheets.
Curated OER
Navigating Your Community
Students draw a map from memory describing the route between their classroom and the gym including a legend, a compass rose, a map scale, symbols, and a landmark at every change of direction. They then retrace their steps in their maps...
Curated OER
Maryland’s Chesapeake Bay Landscape Long Ago and Today
Combine a fantastic review of primary source analysis with a study of Captain John Smith's influence on the Chesapeake Bay region in the seventeenth century. Your young historians will use images, a primary source excerpt, and maps...
Curated OER
A Contouring We Go
Students examine the built environment and infrastructures of their community by constructing contour equipment, using the equipment, and comparing their results to current topographical maps of the same area
Curated OER
Ancient Greece and Ancient Rome Unit Plan
High schoolers make two T charts, one for Sparta and one for Athens, showing pros and cons for living in either city-state. They use the physical information from the map and the cultural captions given for Athens and Sparts to come to...
Curated OER
Trends of Snow Cover and Temperature in Alaska
Students gather historical snow cover and temperature data from the MY NASA DATA Web site. They compare this data to data gathered using ground measurements from the ALISON Web site for Shageluk Lake. They graph both sets of data and...
Curated OER
Perceived Risks
Young scholars rank a list of everyday risks to compare with classmates. They rate each risk on both its ability to be controlled and its observability in the environment. Results are graphed.
Curated OER
Snow Cover By Latitude
Students examine computerized data maps in order to create graphs of the amount of snowfall found at certain latitudes by date. Then they compare the graphs and the data they represent. Students present an analysis of the graphs.
Curated OER
The Bozeman Trail
Eighth graders are introduced to the Bozeman Trail. Using the internet, they research the trail to discover the forts located on its path. They must also locate and label landmarks on a map using symbols they create. They answer...
Curated OER
Where's the Barbecue?
Middle schoolers identify the major landforms, regions and rivers on a map of South Carolina. They compare the locations of the major Native American groups in the state as well. They chart where barbecue restaurants are located and...
Curated OER
Draw A Coastline
Students identify, locate and draw at least ten different geographical features on a map. Using the map, they must make it to scale and include their own legend and compass rose. They share their map with the class and answer questions.
Curated OER
Using My Nasa Data To Determine Volcanic Activity
Learners use NASA satellite data of optical depth as a tool to determine volcanic activity on Reunion Island during 2000-2001. They access the data and utilize Excel to create a graph that has optical depth as a function of time for the...
Curated OER
Searching the Attic
Students investigate an attic or basement to "discover" family artifacts. They develop a grid map using string, create a naming system for the grid, and analyze items of interest.
Other popular searches
- Maps Graphs and Charts
- Charts, Graphs, Maps
- Maps, Charts, Graphs, Tables
- Charts, Maps, Graphs
- Charts, Maps and Graphs


