Curated OER
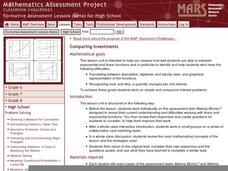
Comparing Investments
Money, money, money. A complete lesson that makes use of different representations of simple and compound interest, including written scenarios, tables, graphs, and equations to highlight similarities and differences between linear and...
Spectrum
Grade 5 Standardized Test Prep
Here you'll find a great sampling of practice standardized test questions organized into four sections: ELA, mathematics, social studies, and science. Help your learners become familiar with the types of multiple-choice questions...
NASA
Development of a Model: Analyzing Elemental Abundance
How do scientists identify which elements originate from meteorites? Scholars learn about a sample of material found in a remote location, analyzing the sample to determine if it might be from Earth or not. They study elements, isotopes,...
NASA
Connecting Models and Critical Questions
Scholars use data to analyze and determine which sets of information need to be counted. They create a model to explain differences among chemical elements using graphs to prove concept mastery.
Math Drills
Multiplication Five Minute Frenzy (E)
How fast can you multiply one- and two-digit numbers? Have kids keep track of their success as they work on these math drills. Each grid features ten numbers on the x axis that kids can multiply by the ten numbers on the y axis.
Curated OER
Algebra 1: Slope as Rate
Students solve problems with slopes. In this algebra lesson, students identify the slope of a line and relate it to the rate of change. They graph their lines on the TI and observe changes in the lines.
Curated OER
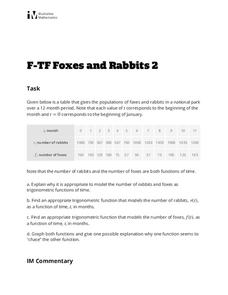
Foxes and Rabbits 2
Explore the relationship between the population of foxes and rabbits in a national park using trigonometric models. Plot data and find the appropriate trigonometric functions. Two questions require interpretation and explanation of...
Illustrative Mathematics
How Many _______ Are In. . . ?
Help your learners gain meaningful understanding of dividing fractions using fraction models. The activity includes nine problems which are sequenced to show how the fraction division algorithm evolves. Have students use graph paper or...
Penn Museum
Africa
Mask wearing is not just for Halloween! This attractive and informative set of worksheets discusses this important African cultural tradition, as well as a variety of other significant cultural attributes to ancient civilizations, such...
Curated OER
Snow Cover By Latitude
Pupils examine computerized data maps in order to create graphs of the amount of snowfall found at certain latitudes by date. Then they compare the graphs and the data they represent. Students present an analysis of the graphs.
Curated OER
Forest Activity: Interpreting a Graph
Pupils research forest growth online. They analyze the parts and contents of a graph, then summarize in narrative form the changes in the forest over time.
Curated OER
Unit 2: Lesson 7
Pupils are introduced to spreadsheets. They conduct a survey of television viewing time of different shows based on different age categories. Students work in small groups. They collect, data and interpret the data from a survey.
Curated OER
Just Graph It!
Students research presidential election voting results, and organize and interpret data on class graphs.
Curated OER
Reaching New Heights
Students explore the relationship between two variables. Students measure their arm span and height. They gather this class data to design a scatter plot. Students interpret the meaning of individual coordinates and the overall graph....
Curated OER
The Tale of Scale
Eighth graders, using a range of data, produce three bar graphs for various scales along the y-axis.
Curated OER
No Title
Sixth graders, after reviewing and studying the basics of recording, analyzing and presenting data, create on graph paper a bar or line graph to represent given data and then interpret the data. They answer questions about the given data...
Curated OER
Twelve Days of Christmas
Young scholars create charts and graphs using a spreadsheet. They chart the number of each gift given day by day from the song, "The Twelve Days of Christmas." They create a bar graph and a circle graph from their data on the spreadsheet.
Curated OER
What's Your Favorite Planet?
Fourth graders interpret a graph and make correlations using data. After taking a class survey, 4th graders create a class graph of their favorite planets. Working in small groups, they interpret the information and create at least ten...
Curated OER
Exploring Scale
Sixth graders discuss how the scale and type of graph can change how the data appears. With a partner, they identify all the information about the graph in a specific amount of time and record them in a journal. To end the lesson plan,...
Curated OER
Investigating Motion, Forces, and Energy Lab Book
Eighth graders create their own experiements using toy trucks, cars or balls to measure the time it takes two of them to travel 5 meters, as well as at each 1 meter interval. They make use computers to make a time/distance graph and...
Curated OER
Tony's Spelling Troubles
Students are introduced to the given problem and describe in their own words the situation represented in a bar chart and tally chart. They then use a bar chart and tally chart to make sensible predictions.
Curated OER
Using Oral History to Understand Immigrant History
Students use oral history to comprehend how life chaned for men, women, and childern when they immigrated to the United States. Students conduct interviews with immigrants in an attempt to interpret hardships, lifestyles, careers, and...
Curated OER
Math & Social Science
Students are given data and are to calculate averages and yearly totals of how many cars travel the Tacoma Narrows Bridge. They also make a graph of the data.
Curated OER
McCadam's Quarterly Report
Fourth graders problem solve a problem from a local business using data, generating graphs, and draw conclusions. They submit their findings in a business letter format with feed back from a company's plant manager.
Other popular searches
- Interpret Charts and Graphs
- Interpreting Bar Graphs
- Interpreting Line Graphs
- Interpreting Circle Graphs
- Interpret Graphs
- Reading Graphs and Charts
- Graphs Interpreting Data
- Bar Graph Interpretation
- Reading Graphs in Science
- Timed Reading Graphs
- Interpreting Graphs Algebra
- Math Interpreting Bar Graphs
