Teach Engineering
Energy Resources and Systems
We've talked a lot about energy, but where does energy come from? Pupils brainstorm different energy sources through a class discussion to kick off the 14th installment of a 25-part Energy Systems and Solutions unit. They then research...
Curated OER
Texas Commemorative Maps: Honoring Our Past
To celebrate Texas, groups plan and create a commemorative map for a topic or theme in Texas history. The richly detailed plan and the approach could easily be adapted to any state. Samples are included.
EngageNY
Interpreting Correlation
Is 0.56 stronger than -0.78? Interpret the correlation coefficient as the strength and direction of a linear relationship between two variables. An algebra lesson introduces the correlation coefficient by estimating and then...
Consumers Energy
The Cost of Electricity
How much is your toaster costing you every day? Young environmentalists calculate the monetary costs of household appliances based on their average consumption of wattage.
Roy Rosenzweig Center for History and New Media
Patriots or Traitors - Point of View in the War for Independence
Patriots or traitors? Class members analyze images that present widely differing views of the Boston Tea Party, identifying the point of view of the image, the propaganda devices used, and the intended audience.
EngageNY
Solve for Unknown Angles—Angles and Lines at a Point
How do you solve for an unknown angle? In this sixth installment of a 36-part series, young mathematicians use concepts learned in middle school geometry to set up and solve linear equations to find angle measures.
EngageNY
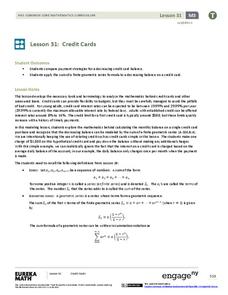
Credit Cards
Teach adolescents to use credit responsibly. The 32nd installment of a 35-part module covers how to calculate credit card payments using a geometric series. It teaches terminology and concepts necessary to understand credit card debt.
EngageNY
Transformations of the Quadratic Parent Function
Efficiently graph a quadratic function using transformations! Pupils graph quadratic equations by completing the square to determine the transformations. They locate the vertex and determine more points from a stretch or shrink and...
EngageNY
Proof of the Pythagorean Theorem
What does similarity have to do with the Pythagorean Theorem? The activity steps through the proof of the Pythagorean Theorem by using similar triangles. Next, the teacher leads a discussion of the proof and follows it by an animated...
EngageNY
Definition of Translation and Three Basic Properties
Uncover the properties of translations through this exploratory lesson. Learners apply vectors to describe and verify transformations in the second installment of a series of 18. It provides multiple opportunities to practice this...
EngageNY
Applications of the Pythagorean Theorem
Examine the application of the Pythagorean Theorem in problem-solving questions. Pupils apply the theorem to find lengths when given different scenarios. They finish the 17th installment in an 18-part series by applying the theorem...
EngageNY
The Difference Between Theoretical Probabilities and Estimated Probabilities
Flip a coin to determine whether the probability of heads is one-half. Pupils use simulated data to find the experimental probability of flipping a coin. Participants compare the long run relative frequency with the known theoretical...
EngageNY
Using Sample Data to Compare the Means of Two or More Populations II
The 23rd segment in a series of 25 presents random samples from two populations to determine whether there is a difference. Groups determine whether they believe there is a difference between the two populations and later use an...
EngageNY
Why Worry About Sampling Variability?
Are the means the same or not? Groups create samples from a bag of numbers and calculate the sample means. Using the sample means as an estimate for the population mean, scholars try to determine whether the difference is real or not.
EngageNY
Using Sample Data to Compare the Means of Two or More Populations
Determine whether there is a difference between two grades. Teams generate random samples of two grade levels of individuals. Groups use the mean absolute deviation to determine whether there is a meaningful difference between the...
EngageNY
Describing Variability Using the Interquartile Range (IQR)
The 13th activity in a unit of 22 introduces the concept of the interquartile range (IQR). Class members learn to determine the interquartile range, interpret within the context of the data, and finish by finding the IQR using an...
EngageNY
Developing a Statistical Project
The 17th lesson in a unit of 22 presents asks the class to conduct a statistics project. Pupils review the first two steps of the process of asking a question and collecting data. They then begin the process by developing a...
EngageNY
Summarizing a Data Distribution by Describing Center, Variability, and Shape
Put those numbers to work by completing a statistical study! Pupils finish the last two steps in a statistical study by summarizing data with displays and numerical summaries. Individuals use the summaries to answer the statistical...
Curated OER
Animated Snowman
Students produce a web page with an animated snowman using DHTML and JavaScript. The finished project must work correctly in Netscape 4.7 and Internet Explorer 5.0 on both Mac and PC.
Curated OER
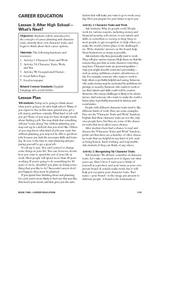
After High School— What’s Next?
Exploring and discovering what to do after high school graduation is a very real topic for 12th graders. They examine their own character traits, the traits commonly needed in specific careers, and what type of career best suits them...
Teach Engineering
Buoyant Boats
Eureka! Using the clay boats made in the previous lesson, learners investigate the idea of buoyancy and water displacement to finish the last installment of five in a Floaters and Sinkers unit. Their observations during the activity...
Curated OER
Mini-Landslide
Students explore how different materials (sand, gravel, lava rock) with different water contents on different slopes result in landslides of different severity. They measure the severity by how far the landslide debris extends into model...
Curated OER
Amounts of Dissolved Oxygen in Various Bodies of Water
Students test water to determine the dissolved oxygen content while displaying the proper use of testing instruments while visiting water testing sites. They determine if the amount of dissolved oxygen is appropriate for the tested...
Curated OER
Babylonian Mathematics I
Learners examine a Babylonian clay tablet and the mathematics found on it as a catalyst to investigate a variety of mathematical ideas. They work with prime numbers, classify numbers as whole, integer, rational, or irrational and use...
Other popular searches
- Great Expectations Quiz
- Dickens Great Expectations
- Great Expectations Unit
- Great Expectations Test
- Great Expectations Review
- Great Expectations Unit Test
- Great Expectations Unit Plan
- Dickens' Great Expectations
- Great Expectations Dickens"
- Great Expectations 44


