Curated OER
Heating Curve
Wow! This is a nifty presentation for teaching high school chemists about the heating curve. It displays a graph for temperature vs. heat added, then enters the curve itself. The final slide identifies each part of the curve. Notes are...
Curated OER
Heating Curve Lab
Tenth graders examine the heating curve of water when head is added constantly over time. They input values into a calculator as they record water temperature every thirty seconds as it is heated on a hot plate. They complete the...
Curated OER
Ice Cream Lab
I scream, you scream, we all scream for ice cream! Even high schoolers enjoy making ice cream. This laboratory exercise has them record the temperature changes throughout the process of liquid becoming solid, graph the results, and...
Curated OER
What on Earth is Matter?
A somewhat strangely formatted slide show that contains multiple examples of matter types. The classification and state explanations given would be useful as practice of substance identification and the heating curve may prove to be...
Curated OER
Energy Transfer (Heat)
The pages of this resource are in landscape view and ready-made to use as slides in a presentation on energy transfer in your high school physical science course. Begin with pertinent vocabulary and finish with an explanation of the...
Curated OER
Heating and Cooling Curves
High schoolers experiment with a pure substance and a phase change. In this heating and cooling curves lesson plan, students study the effects of heating and cooling a pure substance to observe a phase change. They determine both the...
Nuffield Foundation
Making a Calibration Curve for Starch Concentration
How well can your class concentrate on solutions? Scholars use colorimeter absorption to explore a starch concentration calibration curve. They add iodine to different starch solutions to see how the concentration of the solution changes.
Kenan Fellows
How Much Heat Can a Phase Change Produce?
Scholars learn about heat release in phase changes. They perform calculations as they compare and contrast a science fiction passage and a home heating application.
Curated OER
Calorimetry Worksheet
For this calorimetry worksheet, students determine the change in enthalpy, sketch the heating curve, and determine the specific heat and heat of fusion for a given compound. This worksheet has 4 problems to solve.
CK-12 Foundation
Broken-Line Graphs: Heating Curve of Water
Examine the unique graphs coined broken-line graphs. Using the phase change of water for data, learners answer questions related to the temperature and energy at different times in the cycle of the phase change. Questions focus on the...
Virginia Department of Education
States of Matter
Scientists have been studying exothermic reactions before they were cool. The lesson begins with a discussion and a demonstration of heat curves. Scholars then determine the heat of fusion of ice and the heat needed to boil water through...
Curated OER
Heat Transfer
The students construct a heating curve and explain its components. They perform calculations. They review phase changes and quantify Energy differences. They review phases of matter and their energy content.
Curated OER
Incoming Solar Radiation
Demonstrate how the spherical shape of the Earth contributes to unequal heating of its surface and results in varying climates at different latitudes. This would be an illuminating addition to your meteorology lessons, especially when...
Curated OER
Activity #15 What Happens To A Liquid As Energy Is Added?
Students model the arrangement of particles in a liquid. They use the model, to demonstrate how a gas is formed from a liquid with no increase in temperature as energy is added. Pupils model the arrangement and movement of gas particles.
Curated OER
Heating/Cooling Curve
In this heating and cooling curve worksheet, students use a given graph of a substance being heated from a solid to a liquid and then a gas over time. They use the graph to answer eleven questions about the phases of the substance and...
Texas State Energy Conservation Office
Investigation: Building a Parabolic-Trough Collector
Amateurs of alternative energy build a mini parabolic-trough solar energy collector and use it to heat water. Temperature is recorded over a three-minute period and the data is graphed and analyzed. Note that in order to paint aquarium...
Curated OER
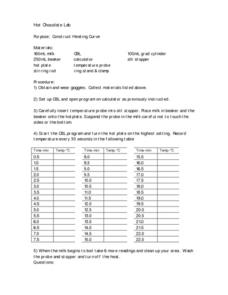
Hot Chocolate Lab
Students wear goggles and collect materials and then set up computer program to use the temperature probes. They insert the probe into the milk recording temperature every 30 seconds and then record the data on the table.
Carnegie Mellon University
Bathtub Model
Using a colorful infographic handout and a guide sheet, hold a class discussion about how a bathtub can serve as a model for the greenhouse effect created by Earth's atmosphere. Participants will understand that as energy or matter is...
Curated OER
Ice Ain't Easy
Learners are introduced to the laws of thermodynamics. The 1st law of thermodynamics states that the energy must be conserved when two objects of different temperatures come in contact. If one object gains energy, the other object must...
Curated OER
More Thermochemistry Problems
This two-page assignment covers basic thermochemistry concepts. Chemistry learners identify exothermic and endothermic processes, explain a phase change graph, and draw an energy level diagram. There are no problems to solve, just...
Curated OER
Iron in Foods
Students determine the amount of iron in a sample of cereal. In this iron lesson plan, students use a computer colorimeter to measure the amount of light absorbed by the solutions. They create a calibration curve using standard solutions...
Teach Engineering
Concentrate This! Sugar or Salt...
Heat up your lessons on boiling points. The resource provides a three-part activity: first, groups find the boiling point of solutions; second, they create boiling point curves for salt and sugar solutions; and third, they mix a solution...
Curated OER
Melting and Freezing Behavior
Young scholars investigate melting and freezing behavior in substances. In this melting and freezing points lesson plan, students perform experiments to test the impact of various salts on the freezing point of water, they test the...
Curated OER
Ice Ain't Easy
Students are told that objects in contact with one another reach an equilibrium temperature. A hot object placed in a cool liquid always cool off. It never happens that the object gets hotter and cool liquid gets colder. Students predict...
Other popular searches
- Heating Curve of Water
- Science Graph Heating Curve
- Heating Curve Lab
- Chemistry Heating Curve
- Heating Curve Formula
- Science Heating Curve
- Construct Heating Curve
- Heating Curve Lesson Plan
- Heating Curve Worksheet


