Curated OER
Childhood Obesity
Students identify a question to generate appropriate data and predict results. They distinguish between a total population and a sample and use a variety of methods to collect and record data. Students create classifications and ranges...
Curated OER
The Millikan L'Eggs Experiment
Students discover a pattern to mysterious eggs made by their teacher. In this mass lesson, students must uncover a secret pattern given plastic eggs and a balance. Students find the eggs have been created with a pattern and draw...
Curated OER
Comparison of Snow Cover on Different Continents
Pupils use the Live Access Server (LAS) to form maps and a numerical text file of snow cover for each continent on a particular date. They analyze the data for each map and corresponding text file to determine an estimate of snow cover...
Curated OER
Box and Whisker Plots
Seventh graders explore the concept of box and whisker plots. In this box and whisker plots instructional activity, 7th graders plot data on a box and whisker plot. Students discuss the mean, median, and mode of the data. Students...
Curated OER
Statistics Newscast in Math Class
Learners study sports teams, gather data about the teams, and create a newscast about their data. In this sports analysis lesson, students research two teams and define their statistical data. Learners compare the two teams, make...
Curated OER
Normal Probability Plot
Students analyze the graph of a distribution. In this statistics lesson, students define skewed or mound shape distribution as they investigate the data behind the graph. They define and plot outlier as well as normal probability.
Curated OER
Paper Parachutes
Students participate in a simulation of a parachute-jump competition by making paper parachutes and then dropping them towards a target on the floor. They measure the distance from the point where the paper parachute lands compared to...
Curated OER
Are Taxes "Normal?"
Learners explore the concept of normal distribution. In this normal distribution lesson, students find the normal distribution of taxes in the 50 US states. Learners make histograms, frequency tables, and find the mean and median of tax...
Curated OER
Graph a Panther's Diet
Students examine the diet of panthers. In this interpreting data lesson plan, students collect data on the panther's diet and chart the data in bar and pie graphs.
Curated OER
Quartiles and Box-and-Whisker Plots
In this algebra worksheet, students identify the central tendencies as they solve a box and whisker plot graph. They identify the quartiles of the data. There are 4 questions with an answer key.
Curated OER
Looking Normal
Students identify the shape of a function. In this statistics instructional activity, students plot the data collected. They analyze their data for positive, negative or no correlation. They find the line of best fit.
Curated OER
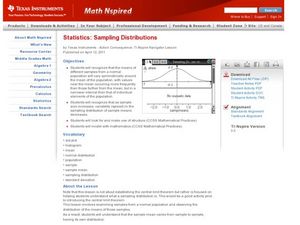
Sampling Distributions
Pupils analyze sampling from different population. For this statistics lesson, students define the meaning of sample sizes and what causes an increase or decrease. They graph their data on the Ti calculator and draw conclusion from the...
Curated OER
Rotation Sensor Challenge
Students participate in a challenge to construct a rotation sensor with the highest degree of accuracy and repeatability. They conduct computer analysis of their sensor using repeated trial.
Curated OER
Heads-Up Probability
Second graders use tree diagrams to predict the possible outcomes of coin tosses. The data they collect and graph also help them predict the likelihood of getting heads or tails when tossing coins the next time.
Curated OER
Memory/Physiology Lab Activity
Students investigate the nervous system and how physical distractions influence mental performance. They work in pairs as a researcher and subject and memorize a series of words with no distractions. After repeating the list of words,...
Curated OER
Suited for Space
A fantastic lesson on survival in outer space should excite your learners! Pupils explore the challenges that living, working, and surviving in space elicit. They focus on the spacesuit itself; how it protects astronauts, and enables...
Curated OER
In the Wake of Columbus
Students explore how the population decreased in native cultures.
Statistics Education Web
It’s Elemental! Sampling from the Periodic Table
How random is random? Demonstrate the different random sampling methods using a hands-on activity. Pupils use various sampling techniques to choose a random sample of elements from the periodic table. They use the different samples to...
Statistics Education Web
Sampling in Archaeology
Compare different random sampling types using an archaeological setting. Scholars collect data from an archaeological plot using simple random samples, stratified random samples, systematic random samples, and cluster random samples....
Curated OER
Mathematics Module
Delve into graphing! The concepts covered begin with basic graphing basic coordinates and algebraic expressions on coordinate planes, and build up to graphing linear inequalities and equations. Learners solve and simplify various...
Virginia Department of Education
Normal Distributions
Pupils work to find probabilities by using areas under the normal curve. Groups work to calculate z-scores and solve real-world problems using the empirical rule or tables.
Virginia Department of Education
The Rate of Motion
How much time does it take to jump over three balloons? Pupils calculate the speed of tasks that require different motions. They determine motions for tasks such as walking, skipping, hopping, and jumping before creating a...
Virginia Department of Education
Heat and Thermal Energy Transfer
How does radiation affect our daily lives? Answer that question and others with a lesson that discusses radiation and its use in thermal energy transfer through electromagnetic waves. Pupils investigate vaporization and...
Virginia Department of Education
Work and Power
Assist your class with correctly calculating the values for force, work, and power as they determine the amount various activities require. They gather data and participate in a group discussion to compare results upon conclusion of the...


