Curated OER
Math Made Easy
Students evaluate word problems. In this problem solving lesson, students are presented with word problems requiring graphing skills and students work independently to solve.
Curated OER
Walking the Plank
Eighth graders experiment with a bathroom scale, books and a plank to determine how weight readings change as distance is applied. They graph and interpret the results.
Curated OER
Instantaneous Rate of Change of a Function
Pupils draw the graph of a door opening and closing over time. They graph a given function on their calculators, create a table of values and interpret the results by telling if the door is opening or closing and evaluate the average...
New York State Education Department
TASC Transition Curriculum: Workshop 4
Why is it important to use precise language? Participants explore this question in the fourth activity in a series of 15 on effective instruction. Perfect for all content areas, the activity promotes appropriate language choice through...
Curated OER
Usage and Interpretation of Graphs
Cooperative groups are formed for this graphing activity. Each group must construct a graph that represents how many eyelets (the holes for laces in shoes), are present in their group. A whole-class bar graph is eventually constructed...
Curated OER
Data Collection in Archaeology
Students research different types of rock art and categorize it into basic groups, classify Powerpoint Images according to interpretation, enter findings into Access template, and interpret results after comparing information with rest...
Curated OER
Tallying Animals
Second graders draw a picture of a pond scene which includes various animals. They exchange pictures and tally the number of animals drawn. Then they record the number on a chart and write a story about their pictures.
Curated OER
Exploring Probability
Fourth graders participate in a lesson that explores probability. They use candy and model cubes to experiment with different outcomes that can be charted if the students can proceed to the objective of the lesson. They discover how...
EngageNY
Measuring Variability for Skewed Distributions (Interquartile Range)
Should the standard deviation be used for all distributions? Pupils know that the median is a better description of the center for skewed distributions; therefore, they will need a variability measure about the median for those...
Charleston School District
The Line of Best Fit
If it's warm, they will come! Learners find a line of best fit to show a relationship between temperature and beach visitors. Previous lessons in the series showed pupils how to create and find associations in scatter plots. Now, they...
Jude Mphoweh
Graphs
Searching for worksheets to include in an elementary math series on bar graphs? Then look no further! This collection of materials has exactly what you need to ensure that your students get plenty of practice reading and analyzing the...
Teach Engineering
Creepy Silly Putty
It might be silly to determine the creep rate of putty but groups will enjoy making different formulations of silly putty and playing with them to understand how the different mixtures behave. The second part of the activity has groups...
NASA
Development of a Model: Analyzing Elemental Abundance
How do scientists identify which elements originate from meteorites? Scholars learn about a sample of material found in a remote location, analyzing the sample to determine if it might be from Earth or not. They study elements, isotopes,...
Beyond Benign
Catalysts and Oxygen
Here is an engaging and hands-on lesson plan that allows high school chemists to demonstrate the effects of a catalyst on various chemicals. They garner knowledge of how reactants and products differ from one another, while analyzing the...
Balanced Assessment
Dollar Line
Challenge the class to develop a story that matches a graph. The short assessment provides a line graph with the vertical axis labeled as dollars. The task asks pupils to develop a description of a situation that could be represented by...
California Education Partners
Animals of Rhomaar
Investigate the growth rates of alien animals. Pupils study fictional animals from another planet to determine how much they grow per year. The investigators plot the growth of their animals over a period of time and then compare them to...
University of Colorado
Solving a Mixed Up Problem
Begin the process of adding and subtracting spectra. Having a basic understanding of occultation events, pupils begin the pursuit to determine what a found atmosphere might contain. Learners work with two graphs and calculate what the...
Smithsonian Institution
For Land's Sake: George Washington as Land Surveyor
Students discuss the importance of land ownership and the purpose of land surveying in the eighteenth century. They interpret a transcript of an eighteenth-century land survey. They survey and area of land. They create a written or...
Curated OER
Frequency, Histograms, Bar Graphs
In this statistics worksheet, students plot and graph their data, then interpret the data using the correct form of graphs. There are 3 detailed questions with an answer key.
Curated OER
Music With a Message
Students write a line by line analysis of a song which they feel expresses a powerful message that can change society for the better. They then present their analysis to the class in an oral report.
Curated OER
Areas Under Curves: An Astronomical Perspective
In this area under the curve worksheet, students use a graph of the number of exoplanets discovered and the year they were discovered to solve 5 problems. Students find the total area under the curve, they find the total number of...
Curated OER
Concept: What's The Chance?
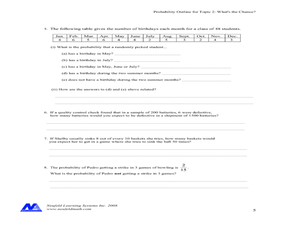
In this concept worksheet, students perform probability experiments. Using collected information, they interpret the data. Students answer questions about probability. This five-page worksheet contains approximately 15 multi-step...
Curated OER
What are the Issues?
Seventh graders complete political analysis activities. In this political analysis lesson, 7th graders discuss party platforms and research party issues for their party's candidate's positions. Students complete an issues organizer and...
Curated OER
Exercise Those Statistics!
Students participate in various activities, measuring their pulse rates and recording the data. They analyze the statistical concepts of mean, median, mode, and histograms using the data from the cardiovascular activities.


