California Academy of Science
Kinesthetic Astronomy: Longer Days, Shorter Nights
A lamp, four globes, and some signs taped around the room are all you need to set up a solar system simulation for teaching how Earth's tilted axis creates the seasons. (Sticky dots are also needed, but not mentioned in the materials...
NOAA
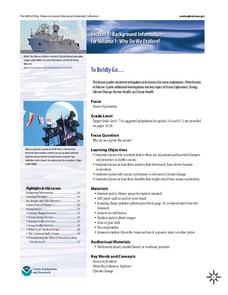
To Boldly Go...
When we think of ocean exploration, many of us have visions of sunken pirate ships full of treasure or mysterious creatures of the deep. What really motivates deep-sea investigation? The first in a series of diverse six-part lessons...
What affects Frog metamorphosis?
In this lab, students explore pollutants which affect frog metamorphosis using household pollutants (vinegar, oil, and bleach) and sponge capsules.
Balanced Assessment
On Averages and Curves
Determine the average on a curve. The class finds graphical representations of averages and expresses them both symbolically and on the graph. The assessment requires class members to justify using average to describe graphs.
Curated OER
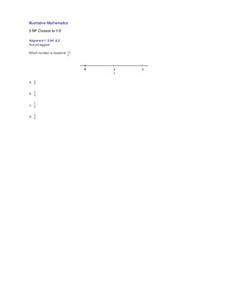
Closest to 1/2
Using a number line, pupils are asked to identify which of four fractions is closest to one half. Includes a single problem that can serve as a practice problem or formative assessment for 3rd or 4th graders learning to partition number...
Curated OER
US Population 1982-1988
Your algebra learners make predictions using the concepts of a linear model from real-life data given in table form. Learners analyze and discuss solutions without having to write a linear equation.
Houghton Mifflin Harcourt
Unit 3 Math Vocabulary Cards (Grade 5)
Fifty-four flashcards make up a set to help reinforce math vocabulary. The set offers two types of cards; a word card printed in bold font, and a definition card equipped with an example and labels. Terms include capacity,...
Curated OER
Worksheet 28: Parametric Equations
In this parametric equations worksheet, students read informational paragraphs and answer 10 questions regarding parameter, velocity, speed, curvature, parametric equations, and scalar curvature.
Curated OER
The Effect of Math Anxiety on Cardiovascular Homeostasis
Using a pulse monitor, learners will measure a resting pulse, take a math test, and then measure the pulse again. They analyze the change in pulse and compare it to performance on the test. This multi-purpose lesson can be used in a...
Curated OER
Drive the Data Derby
Three days of race car design and driving through the classroom while guessing probability could be a third graders dream. Learn to record car speed, distances traveled, and statistics by using calculation ranges using the mean, median,...
Illustrative Mathematics
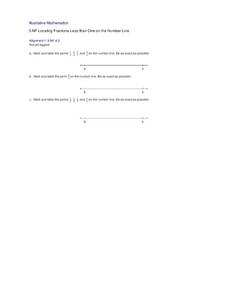
Locating Fractions Less than One on the Number Line
Understanding where to place a fraction on a number line is key to understanding fractions as numbers. This activity focuses on locating fractions less than one. Learners need to partition the line into the correct number of equal sized...
Curated OER
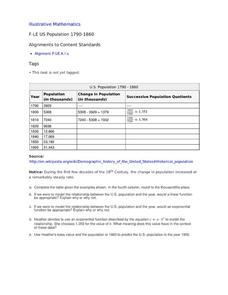
US Population 1790-1860
Your young population scientists analyze a table of values, write a model to represent the real life data, finish the table of data and predict future populations in a collaborative, real-life activity.
NYSU
Understand a Fraction as a Number on a Number Line
Piece by piece young scholars build a basic understanding of fractions in a Common Core-designed elementary math lesson. Through a series of hands-on activities and journaling exercises, and with the help of multiple...
02 x 02 Worksheets
Absolute Value Equations and Inequalities
Demonstrate the meaning of an absolute inequality using three different methods. Here, scholars explore absolute value inequalities through graphing, number line distance, and compound inequalities. Pupils complete various activities to...
EngageNY
Graphs of Exponential Functions
What does an exponential pattern look like in real life? After viewing a video of the population growth of bacteria, learners use the real-life scenario to collect data and graph the result. Their conclusion should be a new type of...
Curated OER
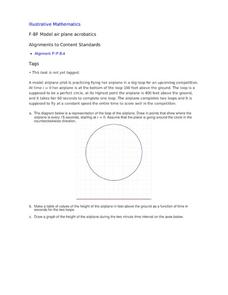
Model Air Plane Acrobatics
Your young airplane enthusiasts will enjoy this collaborative task of graphing an airplane's distance from the ground as it flies in a perfect circle. They will discover that they have graphed a sinusoidal function that comes from the...
Curated OER
Waves
An incredibly colorful PowerPoint presents all the facts and definitions about waves that you could need for beginning physical scientists. There are several useful links to online animations of wave action. This may have been produced...
Curated OER
Worksheet 2: Graphs, Functions and Derivatives
In this math worksheet, young scholars answer 7 questions having to do with graphing derivatives of functions, rectilinear motion, speed and distance.
Curated OER
Lesson: Mary Heilmann: To Be Someone
Kids consider the pure abstraction and minimalism found in Mary Heilmann's work. They analyze several of her pieces through critical discussion and then think about her use of a song title as the title of her exhibit. Learners then use a...
Novelinks
Tuck Everlasting: Time-Line Graphic Organizer Strategy
What happens first in Tuck Everlasting? What happens after that? Prompt readers to create a timeline of the events in Natalie Babbitt's novel, detailing both story sequence and character relationships.
Illustrative Mathematics
Fixing the Furnace
This comprehensive resource applies simultaneous equations to a real-life problem. Though the commentary starts with a graph, some home consumers may choose to begin with a table. A graph does aid learners to visualize the shift of one...
Space Awareness
The Thermal Layers of Oceans
How much does the sun heat up a lake or ocean? Scholars use a cup and a strong lamp to investigate the heat transfer and thermal layers in the ocean to come up with the answer. They collect data and graph it in order to better understand...
Curated OER
Latino Americans and Immigration Laws: Crossing the Border
Students identify both views on U.S. immigration policy. They write a persuasive essay defending either a liberal or restrictive immigration policy. Students identify the major laws regulating immigration since 1875. They create a...
Curated OER
Exercise Set 2.6: An Introduction to Functions
In this functions learning exercise, students solve 70 short answer questions. Students find domain of functions and evaluate them for a given value. Students determine if a mapping diagram represents a function.
Other popular searches
- Time Intervals
- Time 5 Minute Intervals
- Tell Time 1 Hour Intervals
- Time Intervals in Math
- Math Time Intervals
- Telling Time Intervals
- Time in 5 Minute Intervals
- One Minute Interval
- Time Intervals Lesson Plans

