Curated OER
Probability Experiment Simulation: Design and Data Analysis Using a Graphing Calculator
Seventh graders simulate probability experiments. Using a graphing calculator, 7th graders design, conduct, and draw conclusions from simulations or probability experiments. Students construct frequency tables and compare the...
Curated OER
"Lucky Charms": Interpreting Data and Making Predictions
Seventh graders determine if a "lucky charm" will increase their chances of winning a game. Students calculate the experimental probability of each player in a game. They observe and collect data from each activity. Students compare the...
Curated OER
Many Passages: The Voyage of the Slave Ship Brookes
Examine three perspectives of the slave trade - captain, sailor, and captive - through this collaborative analysis activity. Small groups study one perspective with a primary source to analyze. They discern what is a historical fact and...
Curated OER
Expanding the Story of the Montgomery Bus Boycott
Introduce the class to the Civil Rights Movement by taking a critical look at the Montgomery Bus Boycott in 1955. They will pay close attention to the role women played in organizing the boycott and bringing national attention to the...
PBS
Predicting/Making a Hypothesis
As an introduction to the hypothesis and testing method of investigation, young history detectives engage in a special investigation of a family artifact. After watching a short video that demonstrates the method, they develop a...
Zip Grade
ZipGrade
Imagine using your smart phone or tablet to grade a class set of quizzes in less than a minute. Imagine getting immediate results and being able to give immediate feedback. No hunting for scantrons. No waiting in line for the scantron...
Code.org
Creating Summary Tables
Let the computer summarize all that data. Pairs work together to learn how to create pivot tables by following directions in the online module. They then utilize the data collected from the beginning of the unit to create their own...
Library of Congress
Stars, Stripes and Symbols of America: Comparing Our Flag, Past and Present
Your young historians will compare and contrast the details of the American flag today with an an image of the nation's flag from the post-Civil War era, and identify the flag's importance as a national symbol through analysis worksheets...
Mathed Up!
Pie Charts
Representing data is as easy as pie. Class members construct pie charts given a frequency table. Individuals then determine the size of the angles needed for each sector and interpret the size of sectors within the context of frequency....
Curated OER
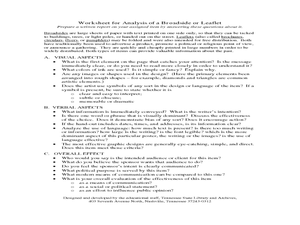
Worksheet for Analysis of a Broadside or Leaflet
In this primary source analysis worksheet, learners respond to 15 short answer questions that require them to analyze leaflets or brochures of their choice.
Curated OER
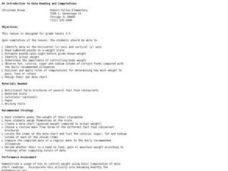
An Introduction to Data Reading and Computations
Learners discover data reading and computations. In this math lesson plan, students collect nutritional data about intakes of certain foods compared with daily recommended allowances. Learners create their own data charts based on their...
Curated OER
Pictures of Data: Post Test
In this data learning exercise, students answer multiple choice questions about charts and graphs. Students answer 10 questions total.
Curated OER
Worksheet for Analysis of an Artifact
In this primary source analysis worksheet, students respond to 20 short answer questions that require them to analyze an artifact of their choice.
Curated OER
Organizing Data
Third graders investigate ways to organize data. In this tally marking lesson plan, 3rd graders practice drawing tally marks to represent an item of data. Students also make connections with skip counting by fives.
Curated OER
Dynamite Data
Second graders rotate through a variety of stations designed to offer practice in manipulating data. They sort, tally and count items and then create bar graphs, tables, and pie graphs to record their findings.
Curated OER
Poster Analysis
In this primary source analysis worksheet, students analyze historical posters of their choosing and respond to 10 analysis questions about the posters.
Curated OER
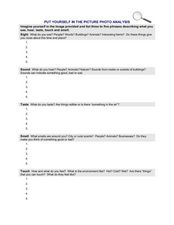
Put Yourself in the Picture Photo Analysis
In this primary source analysis instructional activity, students select historical photographs and then respond to 25 analysis questions that address the senses regarding the photograph they select.
Curated OER
Photograph Analysis Worksheet
In this photograph analysis activity, students are presented steps for analyzing photographs that include observation, inference, and further questioning.
Curated OER
Can You Count on Cans?
How can a canned food drive be connected to math? It's as simple as counting and organizing the cans! Children demonstrate their ability to sort non-perishable foods into categories that include soup cans, vegetable cans, boxed items,...
Curated OER
And You Thought Gasoline Was Expensive!
Students carry out a cost analysis. In this comparative math lesson, students compare the cost of equal measures of gasoline to mouthwash, house paint, fruit juice, white-out, and other liquids.
Curated OER
Seeing Is Believing
Students investigate the concepts of probability. They use data to find the central tendency, median, and mode. Students design and play a game in order to practice the concepts. They also complete a table with data that is analyzed.
Curated OER
Graphing It Daily
Students identify and demonstrate a positive learning attitude and use basic concepts and skills. Learners also communicate clearly in oral, artistic, written, and nonverbal form. Finally, students participate in the daily data...
Curated OER
Energy Audit
Students collect data about energy usage and use mathematical calculations to analyze their data. In this energy conservation and statistics math lesson, students survey their homes to complete an energy usage worksheet. Students...
University of Minnesota
Memory Items
Ready to have an "unforgettable" time in science class? Try a fun and insightful activity, suitable for a wide age group of learners. Explore how human memory works when pupils try to remember objects they've seen before comparing the...


