Alabama Learning Exchange
Add, Subtract, and Multiply Matrices
Introduce the concept of matrices with a pre-designed instructional activity. Learners watch video lessons to learn the ins and outs of adding, subtracting, and multiplying matrices. Using provided problems, they practice each operation...
Alabama Learning Exchange
Building Functions: Composition of Functions
Hammer away at building different types of functions. An engaging lesson builds on learners' knowledge of domain and range to create an understanding of composite functions. Young scholars learn to write composite functions...
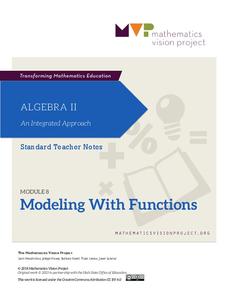
Mathematics Vision Project
Module 8: Modeling With Functions
Sometimes there just isn't a parent function that fits the situation. Help scholars learn to combine function types through operations and compositions. Learners first explore a new concept with an introductory activity and then follow...
BW Walch
Linear & Exponential Functions
Positioned inside the framework of linear and exponential functions, this lesson is more of an investigation into the effects of changing variables and constants inside an expression. The author takes familiar formulas, those for...
Curated OER
Integration: Statistics, Measures of Central Tendency
Learners find the mean, median, and mode for each of four data sets. They are given two line plots, and compute the median and mode of the shown data. They find the median and mode for three stem and leaf plots. They solve two word...
Curated OER
Investigation: Linear Quadratic Systems
Investigate linear quadratic systems and pose this question: Do all linear quadratic systems have two solutions? Do they all have a solution? Learners solve systems of equations through graphing. They indicate the points of intersection...
Curated OER
Probability and Applications of Simulations
Middle schoolers apply properties of probability to the real world. In this probability lesson, learners simulate the construction of empirical distribution. They collect and analyze data using central tendencies.
Curated OER
The Way to Better Grades!
Pupils collect and analyze data. In this statistics lesson, learners create a scatter plot from their collected data. They use, tables and graphs to analyze the data and mae decisions.
Curated OER
Graphing and Interpreting Linear Equations in Two Variables
Graph linear equations using a table of values. Learners solve equations in two variables using standard form of an equation. They identify the relationship between x and y values.
Curated OER
Extension: Using Variables and Expressions
Here is a variables and extensions worksheet in which learners create variable tables to solve a set of seven problems, then discuss which businesses described in the problems they would like to start.
Curated OER
Strike a Pose: Modeling in the Real World (There's Nothing to It!)
Adjust this activity to fit either beginning or more advanced learners. Build a scatter plot, determine appropriate model (linear, quadratic, exponential), and then extend to evaluate the model with residuals. This problem uses...
Curated OER
The Phone Bill Problem
Students write an equation for a linear function. In this algebra lesson, students collect data, plot it and graph it. They identify the equation of the graphed data and define the slope and y-intercept of the graph.
Curated OER
1-3 Study Guide: Order of Operations
The order of operations is compared to punctuation in a sentence: it makes the meaning clear. After two example problems are solved according to a four-step format, your math class evaluates 12 expressions on their own. Learners could...
EngageNY
Integer Exponents
Fold, fold, and fold some more. In the first installment of a 35-part module, young mathematicians fold a piece of paper in half until it can not be folded any more. They use the results of this activity to develop functions for the area...
EngageNY
Solving Basic One-Variable Quadratic Equations
Help pupils to determine whether using square roots is the method of choice when solving quadratic equations by presenting a lesson that begins with a dropped object example and asks for a solution. This introduction to solving by...
EngageNY
Modeling Relationships with a Line
What linear equation will fit this data, and how close is it? Through discussion and partner work, young mathematicians learn the procedure to determine a regression line in order to make predictions from the data.
EngageNY
Mental Math
Faster than a speedy calculator! Show your classes how to use polynomial identities to multiply numbers quickly using mental math.
EngageNY
Modeling with Polynomials—An Introduction (part 2)
Linear, quadratic, and now cubic functions can model real-life patterns. High schoolers create cubic regression equations to model different scenarios. They then use the regression equations to make predictions.
EngageNY
The Motion of the Moon, Sun, and Stars—Motivating Mathematics
What does math have to do with the behavior of the earth and sun? Learn how the movement of celestial bodies has influenced the development of trigonometry. Scholars connects the details in mathematics to their...
EngageNY
Why Call It Tangent?
Discover the relationship between tangent lines and the tangent function. Class members develop the idea of the tangent function using the unit circle. They create tables of values and explore the domain, range, and end behavior of...
EngageNY
Modeling a Context from a Verbal Description (part 2)
I got a different answer, are they both correct? While working through modeling problems interpreting graphs, the question of precision is brought into the discussion. Problems are presented in which a precise answer is needed and...
EngageNY
Margin of Error When Estimating a Population Mean (part 1)
We know that sample data varies — it's time to quantify that variability! After calculating a sample mean, pupils calculate the margin of error. They repeat the process with a greater number of sample means and compare the results.
EngageNY
Ruling Out Chance (part 3)
Pupils analyze group data to identify significant differences. They use simulation to create their own random assignment data for comparison.
EngageNY
Evaluating Reports Based on Data from an Experiment
They say you can interpret statistics to say what you want them to. Teach your classes to recognize valid experimental results! Pupils analyze experiments and identify flaws in design or statistics.


