Curated OER
Pre Algebra Variables
Here is a variable equations worksheet which invites learners to solve equations with variables in them involving addition, subtraction, multiplication, and division. Pupils complete nine problems.
EngageNY
Word Problems Leading to Rational Equations
Show learners how to apply rational equations to the real world. Learners solve problems such as those involving averages and dilution. They write equations to model the situation and then solve them to answer the question —...
EngageNY
Calculating Conditional Probabilities and Evaluating Independence Using Two-Way Tables (part 2)
Without data, all you are is another person with an opinion. Show learners the power of statistics and probability in making conclusions and predictions. Using two-way frequency tables, learners determine independence by analyzing...
EngageNY
The Multiplication of Polynomials
If you can multiply multi-digit integers, you can multiply polynomials. Learners use an area model to compare multiplying numbers to multiplying polynomials. They progress to using the distributive property.
West Contra Costa Unified School District
Lowest Common Multiple through the Grades
The LCM will be your new BFF. Learners review least common multiple and least common denominator applications, mostly on fractions, from middle school. Scholars then see how the LCM can be applied to various types of problems from...
EngageNY
Relationships Between Quantities and Reasoning with Equations and Their Graphs
Graphing all kinds of situations in one and two variables is the focus of this detailed unit of daily lessons, teaching notes, and assessments. Learners start with piece-wise functions and work their way through setting up and solving...
EngageNY
Distributions—Center, Shape, and Spread
Data starts to tell a story when it takes shape. Learners describe skewed and symmetric data. They then use the graphs to estimate mean and standard deviation.
EngageNY
Normal Distributions (part 1)
Don't allow your pupils to become outliers! As learners examine normal distributions by calculating z-scores, they compare outcomes by analyzing the z-scores for each.
West Contra Costa Unified School District
Factoring Quadratic Expressions
Factor in different strategies in a lesson plan for factoring quadratics. Young mathematicians first create tables and area models to factor quadratic trinomials into two binomials by guess and check. Learners then investigate how they...
EngageNY
Polynomial, Rational, and Radical Relationships
This assessment pair goes way beyond simple graphing, factoring and solving polynomial equations, really forcing learners to investigate the math ideas behind the calculations. Short and to-the-point questions build on one another,...
EngageNY
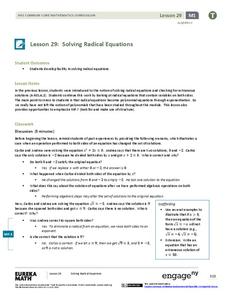
Solving Radical Equations
Learners solve complex radical equations. Solutions vary from one, two, and none, allowing pupils to gain experience solving a variety of problems.
EngageNY
The Height and Co-Height Functions of a Ferris Wheel
Show learners the power of mathematics as they model real-life designs. Pupils graph a periodic function by comparing the degree of rotation to the height of a ferris wheel.
EngageNY
Extending the Domain of Sine and Cosine to All Real Numbers
Round and round we go! Pupils use reference angles to evaluate common sine and cosine values of angles greater than 360 degrees. Once they have mastered the reference angle, learners repeat the process with negative angles.
EngageNY
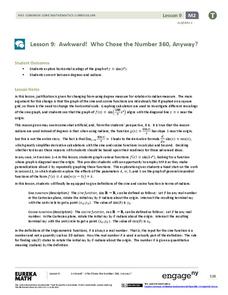
Awkward! Who Chose the Number 360, Anyway?
Don't give your classes the third degree. Use radians instead! While working with degrees, learners find that they are not efficient and explore radians as an alternative. They convert between the two measures and use radians with the...
EngageNY
Tides, Sound Waves, and Stock Markets
Help pupils see the world through the eyes of a mathematician. As they examine tide patterns, sound waves, and stock market patterns using trigonometric functions, learners create scatter plots and write best-fit functions.
EngageNY
Graphing the Tangent Function
Help learners discover the unique characteristics of the tangent function. Working in teams, pupils create tables of values for different intervals of the tangent function. Through teamwork, they discover the periodicity, frequency, and...
EngageNY
What Is a Trigonometric Identity?
Protect yourself from identity theft! Establishing a strong understanding of the Pythagorean identity allows learners to prove that sine^2x + cos^2x = 1. They then use the identity to find sine or cosine ratios given the other.
EngageNY
Probability Rules (part 2)
Ensure your pupils are rule followers! Learners add the addition rule to the set of probability rules examined in the previous lesson. Problems require both the multiplication and addition rule.
EngageNY
Normal Distributions (part 2)
From z-scores to probability. Learners put together the concepts from the previous lessons to determine the probability of a given range of outcomes. They make predictions and interpret them in the context of the problem.
EngageNY
Sampling Variability in the Sample Proportion (part 1)
Increase your sample and increase your accuracy! Scholars complete an activity that compares sample size to variability in results. Learners realize that the greater the sample size, the smaller the range in the distribution of sample...
EngageNY
Sampling Variability in the Sample Proportion (part 2)
Increase your sample and increase your accuracy! Scholars complete an activity that compares sample size to variability in results. Learners realize that the greater the sample size, the smaller the range in the distribution of sample...
EngageNY
Margin of Error When Estimating a Population Proportion (part 1)
Use the power of mathematics to find the number of red chips in a bag — it's a little like magic! The activity asks learners to collect data to determine the percentage of red chips in a bag. They calculate the margin of error and...
EngageNY
Sampling Variability in the Sample Mean (part 2)
Reduce variability for more accurate statistics. Through simulation, learners examine sample data and calculate a sample mean. They understand that increasing the number of samples creates results that are more representative of the...
EngageNY
Drawing a Conclusion from an Experiment (part 1)
Challenge your classes to complete an experiment from beginning to end. Learners make their own hypotheses, collect and analyze their own data, and make their own conclusions. They are on their way to becoming statisticians!


