Curated OER
A Line Graph of the Ocean Floor
Young scholars develop a spreadsheet and import the information into a line graph. In this spreadsheet and line graph lesson, students develop a spreadsheet of ocean depths. They import the information into a word processed document....
Federal Reserve Bank
Less Than Zero
Perry the penguin wants to buy a new scooter, but he doesn't have any funds! Walk your kids through the short book Less Than Zero, and have them track his borrowing, spending, and saving on a line graph while you read. Pupils will learn...
Math Drills
Thanksgiving Cartesian Art: Pilgrim Hat
What did some Pilgrims wear on top of their heads? Individuals graph sets of ordered pairs, and connect the points to create a mystery Thanksgiving picture.
Curated OER
The Gathering and Analysis of Data
Young mathematicians gather data on a topic, graph it in various forms, interpret the information, and write a summary of the data. They present their data and graphs to the class.
Living Rainforest
Finding the Rainforests
From Brazil to Indonesia, young scientists investigate the geography and climate of the world's tropical rain forests with this collection of worksheets.
Yummy Math
Parametric Equations and a Heart
Trigonometry, art, and Valentine's Day come together in a creative activity about parametric equations. Learners calculate several equations before graphing them either by hand, on a graphic calculator, or Excel spreadsheet to curve...
Curated OER
Writing Crazy Crayons
Second graders observe the workings of an assembly line. They classify old crayon pieces by color, melt them in candy molds, package them, and produce advertising literature to sell the product. Students share their work with the class.
Curated OER
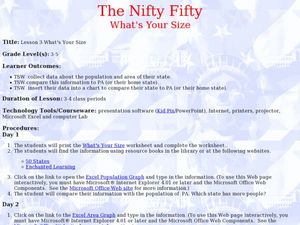
The Nifty Fifty-What's Your Size?
Students explore state populations. In this state geography lesson, students use a variety of technology tools to research and graph population and area of assigned states.
Curated OER
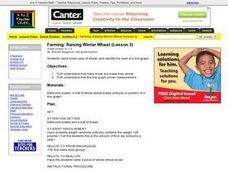
Farming: Raising Winter Wheat (Lesson 3)
Students identify foods that are made from wheat. They use a line graph to explain measurement. They identify foods from the food groups and explain how temperature, prefcipitation and natural resources affect the growth of wheat.
Curated OER
Black History Project
Third graders explore and analyze about famous African-Americans by listening to four picture book biographies. They generate a list of 15 famous African-Americans and then create a survey to rank them according to importance of...
Curated OER
Picture a Nation
Students research immigration data from a specific time period. They create a graphic organizer that depicts the information and share the information with the class.
Curated OER
Indian Resistance
Students observe the pictures and maps of the Sequoyah Indians. In this Sequoyah lesson plan, students use the maps and pictures to discuss observations and write responses of the Indian point of view.
Curated OER
Water and Land 207
Students examine maps of different projections, mathematically calculate distortions, and note the advantages and disadvantages of each map. They study the different maps and transfer the map to graph paper.
Geophysical Institute
Latitude and Longitude with Google Earth
Travel the world from the comfort of your classroom with a lesson that features Google Earth. High schoolers follow a series of steps to locate places all over the earth with sets of coordinates. Additionally, they measure the distance...
Curated OER
Around the World
Young scholars explore ways people from around the world are like them. They discuss how geography affects the way people live and work and how culture affects a person's day to day life. Students give a presentation over a chosen...
Curated OER
Farming and the Services of a Community (Lesson 5)
Students identify different types of farms and services of a community. They use a pretend farm scenerio and a worksheet to distinguish between the different types of farms. They also practice using new vocabulary.
Curated OER
Magical Maps
Second graders discuss the importance of using maps and how they are used. After they listen to a folktale, they develop their own story line maps and write their own folktale to accompany a map. They also identify and locate the seven...
Curated OER
Fame, Fortune, and Philanthropy
With your middle schoolers, develop concepts such as philanthropy, civic responsibility, community service, and common good. Discuss famous philanthropists and what we can each give of our time, talent and treasure to better our...
Curated OER
A Bird's Eye View of our 50 States
Third graders focus on state birds as they learned absolute location (latitude/longitude) of each state, as well as their relative location (bordering states).
Curated OER
Social Studies:
Students identify various types of breads fromother countries and locate them on maps. In small groups, they make story maps of books that mention bread and make books resembling sandwiches. Students have a bread tasting party and...
Curated OER
Foreign Language: Travel Brochure
Students research either French or Spanish speaking countries. After compiling information covering the geography, people,government, economy, and culture, they produce travel brochures on their respective countries.
Curated OER
Bringing an Online News Report to Life
In this online news report tips worksheet, students read five tips about creating an online report and then write five tips of their own.
Curated OER
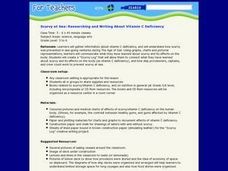
Scurvy at Sea: Researching and Writing About Vitamin C Deficiency
Students gather information about vitamin C deficiency, and research how scurvy was prevented in sea-going ventures during The Age of Sail. They create a "Scurvy Log" that will allow them to connect what they have learned about scurvy...


