Curated OER
A Line Graph of the Ocean Floor
Learners develop a spreadsheet and import the information into a line graph. In this spreadsheet and line graph instructional activity, students develop a spreadsheet of ocean depths. They import the information into a word processed...
Federal Reserve Bank
Less Than Zero
Perry the penguin wants to buy a new scooter, but he doesn't have any funds! Walk your kids through the short book Less Than Zero, and have them track his borrowing, spending, and saving on a line graph while you read. Pupils will learn...
Curated OER
Contour and Cross-Section Skills
In this geography worksheet, learners identify the Wolf Creek Crater and how it was formed. They examine a contour map given of how the crater would look from above. Then, pupils use a ruler to draw lines as on the graph to the side....
US Department of Commerce
Immigration Nation
People come and people go. Given tabular census data on the annual number of immigrants from four different regions of the world between 2000 and 2010, pupils create double bar graphs and line graphs from the data. They analyze their...
Curated OER
Understanding Latitude and Longitude
Teaching learners about latitude and longitude can get a little complicated. Present the concept by first representing it as a graph. Just like finding a location on a graph using the x and y-axis, learners will be able to locate items...
Curated OER
Wind Effects- A Case Study
Students explore hurricanes. In this weather data interpretation lesson, students draw conclusions about the impact of Hurricane Floyd as it related to weather conditions. Students read and interpret a tide data table, a barometric...
Math Drills
Thanksgiving Cartesian Art: Pilgrim Hat
What did some Pilgrims wear on top of their heads? Individuals graph sets of ordered pairs, and connect the points to create a mystery Thanksgiving picture.
Curated OER
A Contouring We Go
Students examine the built environment and infrastructures of their community by constructing contour equipment, using the equipment, and comparing their results to current topographical maps of the same area
Curated OER
Graphs! Graphs! Graphs!
Students practice making charts and graphs from data on spreadsheets. Individually, they create a graph representing the latest information on voter registration. They answer questions and analyze the data to end the lesson.
Curated OER
The Gathering and Analysis of Data
Young mathematicians gather data on a topic, graph it in various forms, interpret the information, and write a summary of the data. They present their data and graphs to the class.
Curated OER
Tides at the Battery, NY
Skill in using Excel and increasing proficiency in manipulating data are challenged with this data analysis work. A web link supplies data and step-by-step instructions help learners create a graph. There are many extension...
Curated OER
Race, Education, and Income: Comparing Carter & Reagan
High school learners compare economic outcomes for 3 racial groups under the presidencies of Jimmy Carter and Ronald Reagan by analyzing a series of graphs, answering questions from a worksheet, and participating in a discussion.
Living Rainforest
Finding the Rainforests
From Brazil to Indonesia, young scientists investigate the geography and climate of the world's tropical rain forests with this collection of worksheets.
Curated OER
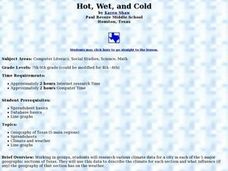
Hot, Wet, and Cold
Students research climate data for a city in each of the 5 major geographic sections of Texas. They use data to describe the climate and what influence the geography of that section has on the weather.
Curated OER
Immigration Graphs
Fourth graders study immigration. In this graphing lesson, 4th graders make a population graph of people who have immigrated to Indiana.
Curated OER
Excel temperature Graphs
Students gather data about the weather in Nome, Alaska. In this Nome Temperature lesson, students create an excel graph to explore the weather trends in Nome. Students will find the average weather and add a trend line to their graph.
Curated OER
Chocolate Preferences Voting and Graphing Techniques
Students practice sampling and graphing techniques. For this data collection and interpretation lesson, students write and conduct surveys about chocolate preferences and then collect their data. Students graph the data in order to...
Yummy Math
Parametric Equations and a Heart
Trigonometry, art, and Valentine's Day come together in a creative activity about parametric equations. Learners calculate several equations before graphing them either by hand, on a graphic calculator, or Excel spreadsheet to curve...
Curated OER
Graphing the Past Using Today's Technology
Eighth graders research statistical data regarding their current social studies unit. They write questions about the measures of central tendency, collect and analyze the data, insert the data into a spreadsheet, and generate graphs.
Curated OER
Fossil Fuels and Its Effects On The World
Learners explore the effects of a declining fossil fuel system would have on the world. They read the line graph and other information to answer questions about fossil fuels. Students use mathematics to analyze graphical data and...
Curated OER
Cities
Students examine U.S. Census figures. In this urban centers lesson, students compare city populations across the span of 50 years. Students create line graphs based on the data.
Curated OER
Aboriginal Statistics
Fourth graders analyze statistics of Native Americans by creating graphs. In this data analysis lesson plan, 4th graders define different statistical terms and practice finding those statistics from groups of numerical information...
Curated OER
Creek Detectives WISE On-line Research Community
Students investigate ways people cause harm to the environment. In this environmental lesson, students explore a case study on the Internet. Students explore all of the online activities and collect data for a presentation.
Other popular searches
- Double Line Graphs
- Graphs. Line Graphs
- Bar and Line Graphs
- Interpreting Line Graphs
- Making Line Graphs
- Reading Line Graphs
- Analyzing Line Graphs
- Creating Line Graphs
- Number Line Graphs
- Reading Double Line Graphs
- Straight Line Graphs
- Bar Graphs Line Graphs


