Teachers Network
A World of Symmetry: Math-Geometry
Define and identify the three basic forms of symmetry translation, rotation, and glides with your class. They cut out and arrange paper pattern blocks to illustrate symmetry, create a Cartesian graph, and design a rug with a symmetrical...
Curated OER
Correlation of Variables by Graphing
Middle and high schoolers use a spreadsheet to graph data. In this graphing lesson, learners determine how two parameters are correlated. They create a scatter plot graph using a computer spreadsheet.
Virginia Department of Education
Charles’ Law
Searching for a relatively interesting way to demonstrate Charles' Law? Here is a lesson in which pupils heat air inside a flask and then cool the flask to quickly cool the air. They make observations about what occurs during the...
EngageNY
Triangle Congruency Proofs (part 2)
Looking to challenge your students that have mastered basic triangle congruence proofs? A collection of proofs employ previously learned definitions, theorems, and properties. Pupils draw on their past experiences with proofs to...
Curated OER
Busted Bubbles
Using the scientific method, and bubble gum, learners conduct a motivating experiment. After conducting a series of tests involving bubble gum, they graph and analyze their results. This is the type of activity everyone loves.
Willow Tree
Angles Formed by Transversals of Coplanar Lines
Create a strong understanding of the relationships formed when parallel lines intersect a transversal. Discuss each type of angle pair and their relationship to each other.
American Statistical Association
Scatter It! (Predict Billy’s Height)
How do doctors predict a child's future height? Scholars use one case study to determine the height of a child two years into the future. They graph the given data, determine the line of best fit, and use that to estimate the height in...
Curated OER
Determination of the solubility product of silver(I) chloride
In this chemistry worksheet, students examine the concept of solubility of silver chloride. The sheet has in depth concept and laboratory instructions.
American Statistical Association
Scatter It! (Using Census Results to Help Predict Melissa’s Height)
Pupils use the provided census data to guess the future height of a child. They organize and plot the data, solve for the line of best fit, and determine the likely height and range for a specific age.
West Contra Costa Unified School District
Correlation and Line of Best Fit
Computers are useful for more than just surfing the Internet. Pupils first investigate scatter plots and estimate correlation coefficients. Next, they use Microsoft Excel to create scatter plots and determine correlation...
Space Awareness
Valleys Deep and Mountains High
Sometimes the best view is from the farthest distance. Satellite imaging makes it possible to create altitude maps from far above the earth. A three-part activity has your young scientists play the role of the satellite and then use...
American Statistical Association
How Tall and How Many?
Is there a relationship between height and the number of siblings? Classmates collect data on their heights and numbers of brothers and sisters. They apply statistical methods to determine if such a relationship exists.
Curated OER
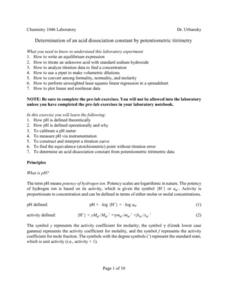
Determination of An Acid Dissociation
In this chemistry worksheet, students examine the given concept in order to apply in the laboratory setting. The sheet includes in depth background information.
Curated OER
Don't Be Tricked By Your Integrated Rate Plot
In this chemistry worksheet, students examine the given concept in order to apply in the laboratory setting. The sheet includes in depth background information.
Virginia Department of Education
Exponential Modeling
Investigate exponential growth and decay. A set of six activities has pupils collecting and researching data in a variety of situations involving exponential relationships. They model these situations with exponential functions and solve...
Virginia Department of Education
Moles Lab Activities
Want my name and number? It's 6.0221415 times 10 to the 23rd, and my name is Avogadro. Providing nine different activities, experiments, and labs, this activity keeps Avogadro relevant to your class all year long.
Illustrative Mathematics
Traffic Jam
Help your learners understand dividing with fractions by using these methods to solve. Chose from two different number lines or linker cubes. This practices "how many groups?" style division problems which help them comprehend why...
Hotchalk
Triangle Sum Theorem
Your visual geometry learners will appreciate triangle drawings as they model the triangle sum theorem and algebraically solve to find the missing interior angle in a triangle. Practice problems increase in complexity and vary in their...
Curated OER
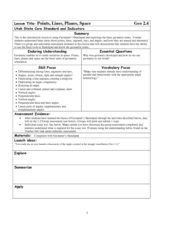
Points, Lines, Planes, and Space
In this points, lines, planes, and space worksheet, students solve word problems dealing with points, lines, planes, and space. Students complete 20 individual problems and 20 group problems.
Virginia Department of Education
Solution Concentrations
What happens when you combine 6.022 times 10 to the 23 piles of dirt into one? You make a mountain out of a mole hill. Scholars use dehydration to obtain percent composition and then calculate the molarity of the original...
Virginia Department of Education
Laboratory Safety and Skills
Avoiding lab safety rules will not give you super powers. The lesson opens with a demonstration of not following safety rules. Then, young chemists practice their lab safety while finding the mass of each item in a mixture and trying to...
Texas Instruments
Vandalism 101
Learners explore logic and use Geometer’s Sketchpad and patterns of logic to solve a puzzle.
Curated OER
Birds' Eggs
More than just data, scatter plots are full of information that can be used to answer a variety of questions. This lesson uses a plot with information about bird egg sizes to answer questions about the relationship between length and...
NASA
Lights on the International Space Station
Groups explore illumination with NASA's Lighting Environment Test Facility (LETF) as a context. Using the TI-Nspire app, groups determine the lux equation that models their simulation. They then use the lux equation to...
Other popular searches
- Linear Measurement Grade 3
- Convert Linear Measurement
- Grade One Linear Measurement
- Linear Measurement Unit Plan
- Math Linear Measurement
- Linear Measurement Lessons
- Technical Linear Measurement
- Math Linear Measurement
- Metric Linear Measurements
- Adding Linear Measurements
- Measurement Customary Linear
- Linear Measurement Metric


