Curated OER
Graph a Situation by Making a Table
Learners graph scenarios values by making a table. In this algebra lesson, students rewrite word problems using algebraic symbols. They make a table of the data, make a graph and analyze the data to extrapolate.
Curated OER
More Graphing Situations by Making a Table
Students calculate rate of change and graph linear functions. In this algebra instructional activity students write linear functions, make a table of points and graph their data on a coordinate plane. They calculate the rate of change of...
Curated OER
Twelve Days of Christmas--Prediction, Estimation, Addition, Table and Chart
Scholars explore graphing. They will listen to and sing "The Twelve Days of Christmas" and estimate how many gifts were mentioned in the song. Then complete a data chart representing each gift given in the song. They also construct...
Curated OER
Conversion Tables
Here are some practical conversion scenarios for scholars to figure out. They examine an example table converting cents to dollars before completing two of their own. For the first, learners convert weeks to days. Some of these are done...
Curated OER
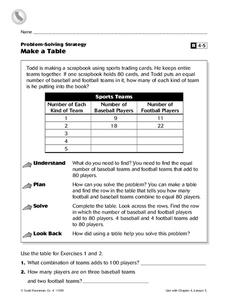
Problem-Solving Strategy: Make a Table
In this problem solving strategy worksheet, students read a word problem and make a table to help solve it. Students then answer 2 additional questions. Answers included on page 2.
DK Publishing
Using Information in Tables
Find out how well can your second or third graders use tables to solve word problems by assigning this single-page worksheet. Two tables with different sets of data prompt learners to solve six problems. An example at the top of the page...
K12 Inc.
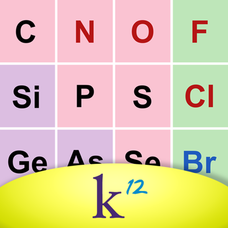
K12 Periodic Table of the Elements
For anyone learning or teaching chemistry, nothing beats a free and interactive periodic table of the elements. Peruse the elements while learning about atomic number and mass, melting and boiling points, and many other properties of...
Curated OER
Making Simple Conversions
Young scholars explore the concept of measurement as it relates to equivalencies. They complete simple conversions using visual models of measurement units, and record their answers in a two-column table.
Curated OER
Rainfall and Water Table
Through inquiry, experimentation, and observation, young scientists see how an increase in rainfall under climate change can affect the water table and soil salinity underground. Young scientists build models that represent the...
Curated OER
Using a Table of Contents
While simple, this resource would be a great way to introduce your class to the use of the Table of Contents. It provides a step-by-step explanation describing how to find information. A teacher could supplement this presentation with...
Math Worksheets Land
Patterns of Association (Using Data Table) - Matching Worksheet
This resource is the last of a four-part series that practices calculating percents based on data represetned in tables. This page has four multiple choice problems that analyze the data tables to answer a question.
Math Worksheets Land
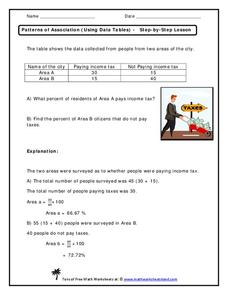
Patterns of Association (Using Data Tables) - Step-by-Step Lesson
This worksheet belongs to a four-part resource that gathers information from data tables to calculate percentages. The page introduces one problem and shares an explanation to the answer.
Illustrative Mathematics
Walk-a-thon 1
Your mathematician's job is to explore the relationship between hours and miles walked during a walk-a-thon. The activity compels your learners to experiment with different means in finding out this proportional relationship. The answer...
PBS
Paper Table
What is black and white and re(a)d all over? Class members build a table out of rolled newspapers. Pupils follow the design process to design, build, and test their paper tables in the second challenge in a series of five.
Illustrative Mathematics
Walk-a-thon 2
During a walk-a-thon your learners must determine the walking rate of Julianna's progress. Using tables, graphs, and an equation, they must be able to calculate the time it took her to walk one mile and predict her distance based on the...
Mathematics Assessment Project
Table Tiling
How many total tiles does it take to tile a table top? Learners apply geometric concepts to determine the number of tiles needed for a specific square table top, and then use the result to create expressions for the number of tiles...
NASA
Modeling the Periodic Table
Imagine a race to complete a puzzle where each person has the same 50 pieces, knows they are missing other pieces, and must figure out how everything fits together. The winner gets fame, listed in books for years to come, and a financial...
University of Texas
Matter and the Periodic Table Chemical Families and Periodic Trends
Is assembling the periodic table as simple as Tetris? Scholars arrange colored cards into a logical order and then make connections to the arrangement of the periodic table. Hands-on activities include adding trend arrows and analyzing...
Teach Engineering
Engineering and the Periodic Table
Elements, to the rescue! Scholars first review the periodic table, and then learn about the first 20 elements and their properties and uses in the fourth of six lessons in the Mixtures and Solutions unit. Applying their newfound...
EngageNY
From Ratio Tables to Equations Using the Value of a Ratio
Use the value of a ratio to set up equations. The teacher leads a discussion on determining equations from ratio tables in the 13th portion of a 29-part series. Pupils determine which of two equations to use to find the solution. They...
Curated OER
The Right Choice
Have class discussions about decision-making and how to solve real life problems with your learners. They will watch videos, talk about truths, fill out outlines, and more.
EngageNY
Making Fair Decisions
Life's not fair, but decisions can be. The 17th installment of a 21-part module teaches learners about fair decisions. They use simulations to develop strategies to make fair decisions.
Curated OER
Learning to Make Data Tables
Students construct data tables using the results of previous experiments. In this graphing lesson, students plot data and interpret the results. Students discuss how they organized their data.
Curated OER
Make a Table
In this charting worksheet, 4th graders complete a table. Using the information provided, students fill in the missing data and complete 2 short answer questions.
Other popular searches
- Make a Table to Problem Solve
- Math Make a Table
- Economics Make a Table
- Multiplication Make a Table
- Use or Make a Table
- Problem Solving Make a Table


