Curated OER
Introduction to Representing and Analyzing Data
Represent data graphically. Allow your class to explore different methods of representing data. They create foldables, sing songs, and play a dice game to reinforce the measures of central tendency.
Curated OER
Reading Graphs
Students plot functions on the Cartesian coordinate plane. They explore lines and parabolas. Students analyze graphs and answer questions about the information presented on the graph using an online program.
Curated OER
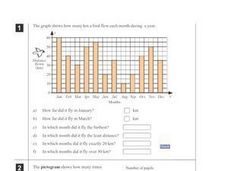
Graphs and Pictograms
In this graphs and pictograms activity, students analyze both a graph and a pictogram and then answer 11 questions about them. Students can click on the Check button to determine whether their answers are correct or not.
Curated OER
Cutting Expenses
Learners explore budgeting. In this finance and math instructional activity, students brainstorm ways in which households could save money. Learners view websites that give cost reducing ideas. Students complete an expense comparison...
Inside Mathematics
Coffee
There are many ways to correlate coffee to life, but in this case a worksheet looks at the price of two different sizes of coffee. It requires interpreting a graph with two unknown variables, in this case the price, and solving for those...
Virginia Department of Education
Analyzing and Interpreting Statistics
Use measures of variance to compare and analyze data sets. Pupils match histograms of data sets to their respective statistical measures. They then use calculated statistics to further analyze groups of data and use the results to make...
Mathematics Vision Project
Features of Functions
What are some basic features of functions? By looking at functions in graphs, tables, and equations, pupils compare them and find similarities and differences in general features. They use attributes such as intervals of...
Achieve
Rabbit Food
Keep your pets slim, trim, and healthy using mathematics! Pupils use a linear programming model to optimize the amount and type of food to provide to a pet rabbit. They model constraints by graphing inequalities and use them to analyze a...
Curated OER
Matrix Analysis of Networks
Explore the connection between a finite graph, a directed graph, and a matrix. Graph lines and identify the relationship of matrices in real-world scenarios. Then use this information to work with a partner to plan and design a town...
5280 Math
More or Less the Same
Tell the story of the math. Given a graph of a linear system, learners write a story that models the graph before crafting the corresponding functions. Graphs intersect at an estimated point, allowing for different variations in the...
Mathematics Vision Project
Module 3: Features of Functions
Learn how to represent functions in multiple ways. Learners analyze functions as equations, graphs, and verbal descriptions. The analysis includes intercepts, behavior, domain, and range. The module of seven lessons makes up the third...
Curated OER
Speed
Fifth and sixth graders practice working in pairs to determine whether they can walk with constant speed. They test themselves, collect their data, draw graphs with their data collected, manipulate the data, and then draw conclusions...
Curated OER
Narrow Corridor
Buying a new sofa? Learn how to use the Pythagorean Theorem, as well as algebra and graphing techniques, to determine whether the sofa will fit around a corner (which I'm sure you'll agree is a very important consideration!).
Curated OER
Sand Babies
An engaging instructional activity which has elementary learners measure weight to the nearest pound and construct and interpret a bar graph! They measure length using non-standard units and determine area using square tiles. Pupils...
Mathematics Vision Project
Module 2: Systems of Equations and Inequalities
The brother-sister pair Carlos and Clarita need your class's help in developing their new pet sitting business. Through a variety of scenarios and concerns presented to the siblings, the learners thoroughly explore systems of equations...
Curated OER
Data Analysis
Young statisticians use and interpret measures of center and spread such as mean, median, and mode as well as range. They use box plots to represent their data and answer questions regarding the correspondence between data sets and the...
Curated OER
Bouncing Ball
Students collect height versus time data of a bouncing ball using the CBR 2™ data collection device. Using a quadratic equation they graph scatter plots, graph and interpret a quadratic function, apply the vertex form of a quadratic...
EngageNY
Comparing Quadratic, Square Root, and Cube Root Functions Represented in Different Ways
Need a real scenario to compare functions? This lesson has it all! Through application, individuals model using different types of functions. They analyze each in terms of the context using the key features of the graphs.
EngageNY
Increasing and Decreasing Functions 2
Explore linear and nonlinear models to help your class build their function skills. In a continuation of the previous lesson, learners continue to analyze and sketch functions that model real-world situations. They progress from linear...
Curated OER
Linear Regression and Correlation
Learners explore scatter plots. In this linear regression lesson, groups of pupils graph scatter plots and then find the line of best fit. They identify outliers and explain the correlation. Each group summarizes and shares their...
Curated OER
Systems of Equations and Inequalities
This is a comprehensive lesson on creating and solving equations and systems of equations and inequalities. Problems range from basic linear equations to more complex systems of equations and inequalities based on a real-world examples....
Curated OER
Environmental Agents of Mathematics: Mathematics for Change
High schoolers analyze environmental science data using Math. They do research about renewable energy, gather data, create graphs and interpret their findings. Then the group presents their arguments persuasively using their findings to...
Curated OER
Statistics Canada
Learners practice using graphing tools to make tables, bar charts, scatter graphs, and histograms, using census data. They apply the concept of measures of central tendency, examine the effects of outliers. They also write inferences and...
Beacon Learning Center
Line Plots
Introduce line plots, show examples of tables, graphing on a number line, and engage in a class discussion. Share the process by which statistical data is organized and displayed on a number line. Examples and worksheets are included....


