Kenan Fellows
Let's Move
Find a statistical reason for a fresh start. Using a hypothetical scenario, individuals research statistical data of three different cities. Their goal? Find the best statistical reason for a business to move to a new location. Their...
Curated OER
Storm Clouds-- Fly over a Late Winter Storm onboard a NASA Earth Observing Satellite
Students study cloud data and weather maps to explore cloud activity. In this cloud data lesson plan students locate latitude and longitude coordinates and determine cloud cover percentages.
Curated OER
Yummy Math
Young mathematicians use bags of Skittles to help them gain practice in graphing and organizing data. They work in pairs, and after they have counted and organized their Skittles, they access a computer program which allows them to print...
Curated OER
Pickles
Young learners compare healthy foods to junk foods. They examine the growing process of a vegetable from a seed all the way to maturity. The book, The Magic School Bus in a Pickle is used. Some nice cross-curricular activities in math,...
Curated OER
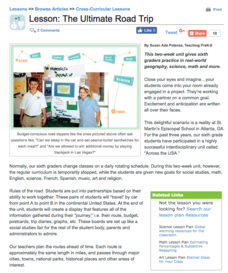
The Ultimate Road Trip
Sixth graders experience and practice real-world geography, science and math as they imagine planning out the ultimate road trip. They set goals and maintain a daily budget as they are given a set of rules as they plan their road trip...
NOAA
Waves
Is it possible to outrun a tsunami? After watching a presentation that explains how waves and tsunamis occur, class members investigate the speed of tsunamis triggered by an earthquake.
Curated OER
Physical Science: Festival of Bubbles
Investigate bubbles through the use of scientific inquiry. Pupils blow bubbles using several methods and measure the resulting bubble print. Measurements are recorded on a data table and transferred to a bar graph. Results are discussed...
Curated OER
Is Portland, Oregon Experiencing Global Warming?
Students use data to determine if the climate in Portland has changed over the years. In this weather lesson students complete line graphs and study long wave radiation.
NASA
Just How Far is That Star?
Pupils often wonder how we know the distance to various stars. Starting with a thought experiment and progressing to a physical experiment, they determine the brightness and distance to various stars. The evaluation requires...
EngageNY
Logarithms—How Many Digits Do You Need?
Forget your ID number? Your pupils learn to use logarithms to determine the number of digits or characters necessary to create individual ID numbers for all members of a group.
Curated OER
Nutrition Lesson Plan
Second graders complete a survey as class answering the question: "Did you eat breakfast this morning?". They place a tally mark in the column that best represents their answer. They then discuss the results in the graph.
Polar Trec
Nature's Density Column
Nature provides density columns in the polar regions that provides food for many animals. Young scientists build their own density columns with water in order to answer analysis questions. Through a slideshow presentation, scholars...
Illustrative Mathematics
Weather Graph Data
Teaching young mathematicians about collecting and analyzing data allows for a variety of fun and engaging activities. Here, children observe the weather every day for a month, recording their observations in the form of a bar graph....
University of Georgia
Using Freezing-Point Depression to Find Molecular Weight
Explore the mathematical relationship between a solvent and solute. Learners use technology to measure the cooling patterns of a solvent with varying concentrations of solute. Through an analysis of the data, pupils realize that the...
Curated OER
The Math in the Design and Building of Bridges
Research various types of bridge designs. Your class will be asked to consider what it would be like without bridges while learning about how they work. They will construct a model bridge based on given parameters. They then calculate...
Virginia Department of Education
Analyzing and Interpreting Statistics
Use measures of variance to compare and analyze data sets. Pupils match histograms of data sets to their respective statistical measures. They then use calculated statistics to further analyze groups of data and use the results to make...
Chymist
The Solubility of a Salt in Water at Various Temperatures
An educational lesson allows young chemists to test the solubility of different types of salt at various temperatures. Groups create a graph using data from unsaturated, saturated, and supersaturated solutions.
Longwood University
How Can We Help Maintain Our Water Supply? Conserving Water
Make young citizens aware of their environmental impact early. An inquiry-based lesson helps learners analyze their own water usage patterns and understand the effects of their habits. Individuals look at data to spot trends and see how...
Curated OER
Human Body Lessons
Learners read "The Magic School Bus in the Human Body" and discuss the importance of maintaining a healthy body. They create a hinge and joint paper skeleton, follow the journey of a hamburger through the digestive tract, jump rope and...
Curated OER
Earthquakes: Fifth Grade Lesson Plans and Activities
After learning about P waves and S waves, fifth graders view the intensity of earthquakes by examining seismographs and images of earthquake damage. Young scientists then forecasting future quakes by analyzing data about...
Curated OER
Volcanoes: Kindergarten Lesson Plans and Activities
In the pre-lab, kindergarteners mimic the movements of the eruption of a volcano and discover various volcanoes around the United States. Then, pupils sort different types of volcanic rocks in the lab before learning how volcanoes grow...
Curated OER
Plate Tectonics: Kindergarten Lesson Plans and Activities
This unit focuses primarily on plate tectonics and plate boundaries surrounding continents. It contains pre- and post-lab sections that walk young geologists through plate movements in order to visualize what's going on inside Earth.
Mascil Project
Closed Greenhouses
Controlling the efficiency of a greenhouse is a mathematical task. A collaborative project challenges learners to create an efficiency plan for a closed greenhouse. Using algebraic equations, they consider a set of constraints, design...
Minnesota Department of Natural Resoures
Minnesota’s Forests
The forests of Minnesota provide middle schoolers with an integrated learning opportunity. They examine the three biomes and their histories, conduct experiments, read stories, and draw pictures. A lovely lesson about trees.


