Baylor College
Global Atmospheric Change: The Math Link
Change up the classroom atmosphere with this interdisciplinary resource. Following along with the children's book Mr. Slaptail's Curious Contraption, these math worksheets provide practice with a wide range of topics including...
Los Angeles County Office of Education
Assessment For The California Mathematics Standards Grade 6
Test your scholars' knowledge of a multitude of concepts with an assessment aligned to the California math standards. Using the exam, class members show what they know about the four operations, positive and negative numbers, statistics...
West Contra Costa Unified School District
Solving Equations Using Balance Scale, Decomposition, and Graphing
There's more than one way to solve an equation — three, actually. Scholars learn how to solve simple linear equations in one variable using three different methods, which include using balance scales, using decomposition (e.g., turning...
CK-12 Foundation
Displaying Categorical Variables: Spending Habits
Bar or circle graph—which is best? Given a circle graph and a total amount of money earned, pupils calculate the amount of money in each category. Learners use the calculated amounts to create a bar graph and compare the two displays.
CK-12 Foundation
Input-Output Tables for Function Rules
How does changing a graph affect the function? Learners watch the changing input-output table as they adjust the location of the line graph. Questions prompt them to complete a table of values and determine the function rule.
Math Learning Center
Third Grade Assessments and Scoring Checklists, Common Core State Standards
How are your learners doing with place value? Track their skill levels with a set of math assessments. The packet includes worksheets to hand out to your class, scoring checklists, a calendar for implementation, and instructions for...
EngageNY
Comparing Linear Functions and Graphs
How can you compare linear functions? The seventh installment of a 12-part module teaches learners how to compare linear functions whose representations are given in different ways. They use real-world functions and interpret features in...
Virginia Department of Education
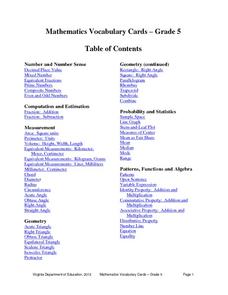
Mathematics Vocabulary Cards - Grade 5
Elevate your fifth graders' understanding of math concepts with a series of vocabulary posters. Featuring terms concerning probability and statistics, measurement, algebra, and decimal place value (and many more), the posters are...
Virginia Department of Education
Mathematics Vocabulary Cards - Grade 2
Augment your math curriculum with posters detailing several concepts important to second grade math. Each poster features one math term from geometry, measurement, probability and statistics, computation and estimation, numbers and...
Curated OER
Prescient Grading
Do homework grades really determine test scores? Learn whether lines of best fit, correlation coefficients, and residuals can be used to determine test scores when given homework grades. (It would certainly save teachers time in grading...
Curated OER
Use Google Maps to Teach Math
Capture the engagement of young mathematicians with this upper-elementary math lesson on measuring time and distance. Using Google Maps, students first measure and compare the distance and time it takes to travel between different...
Curriculum Corner
Fifth Grade Summer Math Booklet
A 33-page packet focuses on fifth-grade math concepts. Learners practice rounding numbers to the hundred thousands, thousands, hundreds, tens, ones, hundredths, thousandths, and hundred thousandths. They also compare whole...
Virginia Department of Education
Functions 1
Scholars learn what it means for a relation to be a function and see various representations of functions. After learning the definition, they participate in a card sorting activity classifying relations as functions or not.
Flipped Math
Unit 1 Review: Analyze Graphs and Expressions
Get in one last practice. Pupils work through 12 problems and a performance task to review the topics in Unit 1. The problems cover analyzing and modeling with graphs, algebraic properties of equality, and adding, subtracting, and...
Curated OER
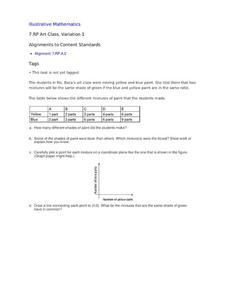
Art Class, Variation 1
Student statisticians calculate ratios to determine how many shades of green were mixed by Ms. Baca's art class. They graph the number of blue parts against the number of yellow parts for each combination and discover that some produce...
Curated OER
Math: Graphs and Their Symbols
Second graders examine different types of graphs and discover the meanings of the symbols used on them. After gathering data about themselves, their communities, and the world, they use that information to create graphs. Among the...
Teachers Network
A World of Symmetry: Math-Geometry
Define and identify the three basic forms of symmetry translation, rotation, and glides with your class. They cut out and arrange paper pattern blocks to illustrate symmetry, create a Cartesian graph, and design a rug with a symmetrical...
Los Angeles County Office of Education
Assessment for the California Mathematics Standards Grade 7
In need of an all-inclusive seventh grade math resource? Packed full of the topics necessary for Pre-Algebra the packet includes practice problems with different difficulty levels. It works great for any supplemental use needed...
Da Vinci Design
Solving Systems of Equations
It can take a lot of time to create one worksheet. You're in luck with a set of five systems of equations worksheets! Each version has a first page solving with substitution, elimination, and graphing; followed with an assortment of...
Curated OER
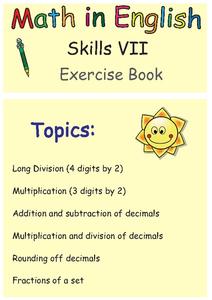
Math in English Skills VII Exercise Book
A great way to help struggling learners with long division is to provide graph paper. These worksheets provide handy boxes to help kids keep all that great work in the right order. It also provides over 20 worksheets to help pupils...
Curated OER
7th Grade Math Worksheet
In this integers activity, 7th graders solve 10 different problems that include various types of integers and graphs. First, they determine the sum of 3 consecutive integers. Then, students find the ratio between 2 areas of similar...
Curated OER
Double Bar Graphs - Homework 7.1
Your learners have seen basic bar graphs, but do they have experience reading double bar graphs? This worksheet details how to draw a double bar graph and provides an example with six accompanying questions. The final question asks...
Curated OER
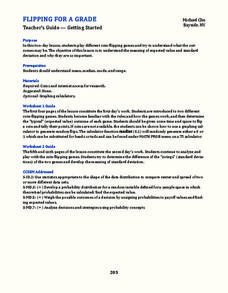
Flipping for a Grade
What happens when your teachers get tired of grading tests and want to use games of chance to determine your grade? How would you decide which game they should play? Learn how to use expected value and standard notation to compare two...
Curriculum Corner
8th Grade Math Common Core Checklist
Ensure your eighth graders get the most out of their math education with this series of Common Core checklists. Rewriting each standard as an "I can" statement, this resource helps teachers keep a record of when each standard was...


