Charleston School District
Volume of Composite Shapes
It's the parts that make the whole. Learners apply volume formulas to composite figures to find the total volume of the figure. Previous lessons in this series taught the methods for finding the volume and/or dimensions of...
Charleston School District
Solving Systems Graphically
When guess and check gets old, it's time to start graphing! An instructive lesson explains how to solve a system of linear equations using graphing. Equations are in both slope-intercepts and standard form.
Charleston School District
Solving Systems with Substitutions
How many large and small watermelons did he sell? Just use the given information to write and solve a system of equations! The two videos accompanying the lesson explain the substitution method and then introduce problem solving. The...
Charleston School District
The Line of Best Fit
If it's warm, they will come! Learners find a line of best fit to show a relationship between temperature and beach visitors. Previous lessons in the series showed pupils how to create and find associations in scatter plots. Now,...
New York City Department of Education
Dance and Text
Use texts and dances to teach inequalities and equations. A sixth-grade unit covers using variables in equations and inequalities to solve problems. Learners show what they know at the end of the unit using two performance tasks, one...
College Board
2005 AP® Calculus BC Free-Response Questions Form B
Let's put it in context. Pupils use the AP® Calculus BC free-response questions to practice for the exam. Five of the six released items deal with mathematical problems, with one using a real-world situation. Learners use differentiation...
Curated OER
Unstable Table
Bothered by a wobbly table? Learn how to fix this problem using concepts of slope and continuity. Pupils first consider the problem in two dimensions and then progress to three dimensions. The solution is really quite simple.
Curated OER
Writing up Math in English
Seventh graders review the steps in writing a math problem. They write story problems stating the situation, the problem to be solved, explaining the process used to solve the problem, and state the answer. Students view a PowerPoint...
Curated OER
Fractions and Decimals
Fractions, decimals, and division are all covered in relation to how they work together. Each term is defined on its own and then in context of the how the relate to the other two terms. The process by which a fraction is converted into...
Curated OER
Dinosaur Math
Young scholars read How to Train with a T.Rex and Win 8 Gold Medals and solve math problems. In this dinosaur math instructional activity, students write a math story to go with the dinosaur story. Young scholars discuss the...
EngageNY
Choosing a Model
There's a function for that! Scholars examine real-world situations to determine which type of function would best model the data in the 23rd installment of a 35-part module. It involves considering the nature of the data in addition to...
EngageNY
The General Multiplication Rule
In the first installment of a 21-part module, scholars build on previous understandings of probability to develop the multiplication rule for independent and dependent events. They use the rule to solve contextual problems.
EngageNY
The Motion of the Moon, Sun, and Stars—Motivating Mathematics
What does math have to do with the behavior of the earth and sun? Learn how the movement of celestial bodies has influenced the development of trigonometry. Scholars connects the details in mathematics to their...
EngageNY
Margin of Error When Estimating a Population Mean (part 2)
Don't leave your classes vulnerable in their calculations! Help them understand the importance of calculating a margin of error to represent the variability in their sample mean.
Illustrative Mathematics
Games at Recess
A great non-calculation problem that lets your math minds explore without the pressure of the right answer. Your learners will have to compare boys and girls playing soccer and jump rope during recess. How many more boys than girls are...
5280 Math
Aquarium Equations
Take a look at linear functions in a new environment. A three-stage algebra project first asks learners to model the salt concentration of an aquarium using linear functions. Then, using iterations, pupils create a set of input-output...
Howard County Schools
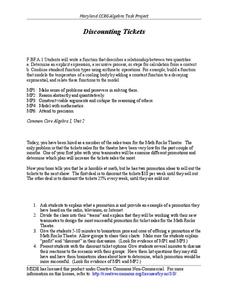
Discounting Tickets
A boss who can't do math? Oh, no! Young entrepreneurs use linear and exponential models to determine which discount will yield the most profit on ticket sales.
Curated OER
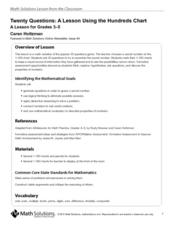
Twenty Questions: The Hundred Chart
Use the 20 Questions game to practice math vocabulary and number properties! Project a hundreds chart and hand one out to learners. Ideally, give them counters (beans would work well) to mark off the chart so you can play multiple times....
Curated OER
Learning Unit: The Pythagorean Theorem
Middle and high schoolers research the life of Pythagoras and the Pythagorean theorem. They write a short biography of Pythagoras and learn to apply the theorem in their study of right triangles.
Curated OER
Two-Digit Subtraction With and Without Regrouping
Second graders subtract two-digit numbers. In this mathematics lesson, 2nd graders subtract both with and without regrouping. Students use manipulatives and place value mats to assist in problem solving.
EngageNY
Solving for Unknown Angles Using Equations III
Challenge your classes to combine geometric and algebraic concepts with an activity that builds on concepts learned in the first three lessons of the series. The fourth part asks scholars to identify geometric angle relationships and use...
EngageNY
Solving Equations Using Algebra 2
If you use a fabulous lesson plan, then your pupils can become fabulous at solving equations. The 24th installment of 25 incorporates the use of if-then statements to illustrate the properties of equality used in solving two-step linear...
Curated OER
The Economics of National Craft Month
Combine National Craft Month and economic math while producing some imaginative, innovative crafts.
EngageNY
Graphs of Quadratic Functions
How high is too high for a belly flop? Learners analyze data to model the world record belly flop using a quadratic equation. They create a graph and analyze the key features and apply them to the context of the video.


