BW Walch
Solving Exponential Equations
Introducing exponential equations means learners need to take all the rules and tricks they learned for exponents and actually apply them. This presentation comes to the rescue by touching on changing bases in exponential...
Willow Tree
Solving Quadratic Equations
Polynomials are full of solutions! Learners understand that the degree determines the number of solutions. Examples show quadratic equations solved by factoring and by using the quadratic formula. A cubic equation is even mixed in for...
Willow Tree
The Pythagorean Theorem
There isn't a more popular geometry formula than the Pythagorean Theorem! Learners understand the special side relationships in a right triangle. They use the Pythagorean Theorem to find missing sides and to solve problems. They begin...
Willow Tree
Approximating a Line of Best Fit
You may be able to see patterns visually, but mathematics quantifies them. Here learners find correlation in scatterplots and write equations to represent that relationship. They fit a line to the data, find two points on the line, and...
Noyce Foundation
Cut It Out
Explore the mathematics of the paper snowflake! During the five lessons progressing in complexity from K through 12, pupils use spatial geometry to make predictions. Scholars consider a folded piece of paper with shapes cut out....
Noyce Foundation
Surrounded and Covered
What effect does changing the perimeter have on the area of a figure? The five problems in the resource explore this question at various grade levels. Elementary problems focus on the perimeter of rectangles and irregular figures with...
California Education Partners
Linflower Seeds
How does your garden grow? Use proportions to help Tim answer that question. By using their understanding of proportional relationships, pupils determine the number of seeds that will sprout. They create their own linear...
California Education Partners
Photos
Why do all sizes of pictures not show the same thing? Class members analyze aspect ratios of various sizes of photos. They determine which sizes have equivalent ratios and figure out why some pictures need to be cropped to fit...
California Education Partners
Animals of Rhomaar
Investigate the growth rates of alien animals. Pupils study fictional animals from another planet to determine how much they grow per year. The investigators plot the growth of their animals over a period of time and then compare...
Concord Consortium
Strings and Areas
You'd be surprised what you can do with a string! The constraint is the length of string, and the task is to maximize area. Given a series of composite shapes, learners must create a formula for the maximum area for a specified...
California Education Partners
Science Fair Project
Plant the data firmly on the graph. Given information about the growth rate of plants, pupils determine the heights at specific times and graph the data. Using the information, scholars determine whether a statement is true and support...
Illustrative Mathematics
Shape Hunt Part 2
Shapes are everywhere in the world around us, from rectangular doors to the circular wheels of a car. The second lesson plan in this series opens the eyes of young mathematicians to this wonderful world of shapes as they search the...
Illustrative Mathematics
Field Day Scarcity
Introduce young mathematicians to concepts of financial literacy with this open-ended word problem. With seven dollars to spend during field day and given a list of available items and their prices, children must determine how they want...
Illustrative Mathematics
Seven Circles III
A basic set-up leads to a surprisingly complex analysis in this variation on the question of surrounding a central circle with a ring of touching circles. Useful for putting trigonometric functions in a physical context, as well as...
Curated OER
Susan's Choice
Young economists explore opportunity cost by counting how much money Susan has in her piggy bank. From here, they are challenged to help Susan make a choice about what she can buy with her money.
Mathematics Assessment Project
Sharing Costs Equitably: Traveling to School
Drive or take the school bus? Class members determine the amount each student would have to pay in a carpool situation. They then evaluate the cost in a set of provided examples. I think I'd rather take the school...
Mathematics Assessment Project
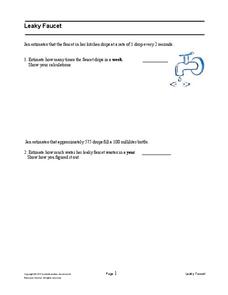
Leaky Faucet
In the assessment task, learners investigate the rate at which a faucet leaks. They use unit conversions to determine the amount of water that leaks in a year. Maybe they should just fix the leak!
Curated OER
Buses
Busy buses bustling back and forth. In this middle school assessment task, learners use information given in a graph to answer questions about bus schedules. They then determine how many times a bus passes by other buses going in the...
West Contra Costa Unified School District
Introduction to Solving Linear Inequalities in One Variable
Life isn't fair ... like inequalities. After first reviewing inequality symbols and how to read inequality statements, learners discover how to solve one-step inequalities and graph their solution sets.
Mathematics Assessment Project
Ratios and Proportional Relationships
Time to see what they've learned. Seventh graders solve a set of seven short problems in the ratios and proportional relationships domain. Applications include photo negatives, washing machines, coffee powder, sleep, stamps, etc.
Statistics Education Web
Odd or Even? The Addition and Complement Principles of Probability
Odd or even—fifty-fifty chance? Pupils first conduct an experiment rolling a pair of dice to generate data in a probability lesson. It goes on to introduce mutually exclusive and non-mutually exclusive events, and how to use the...
Illustrative Mathematics
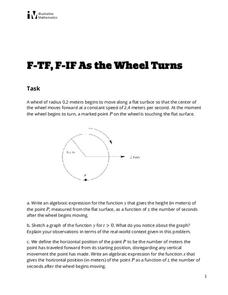
As the Wheel Turns
Determine the location of a point on a moving wheel. The task challenges groups to determine the horizontal and vertical locations of a point on the edge of wheel that is moving. Teams first determine a function that will model the...
Mathed Up!
Pie Charts
Representing data is as easy as pie. Class members construct pie charts given a frequency table. Individuals then determine the size of the angles needed for each sector and interpret the size of sectors within the context of frequency....
CK-12 Foundation
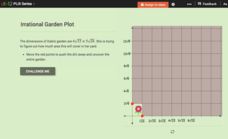
Simplification of Radical Expressions: Irrational Garden Plot
All is not simple in the garden of rationals and irrationals. Learners use a context of a garden to practice simplifying irrational numbers involving radicals. They also find areas of garden with irrational side lengths.


