American Institute of Architects
Architecture: It's Elementary!—First Grade
Build an interest and appreciation for architecture in your young learners with this fun 10-lesson art unit. Engaging children in using their five senses, the class first observes the environment around them, paying...
Statistics Education Web
Sampling in Archaeology
Compare different random sampling types using an archaeological setting. Scholars collect data from an archaeological plot using simple random samples, stratified random samples, systematic random samples, and cluster random samples....
K5 Learning
Finders Keepers
If you found five hundred dollars in the park, would you keep it or turn it in? Exercise both reading comprehension skills and philosophic beliefs in a language arts reading activity about three boys who stumble upon a small fortune...
College Board
2005 AP® Statistics Free-Response Questions
A little context will go a long way. The six released free-response questions from the 2005 exam, show how AP® Statistics uses context within their problems. Pupils use the questions to practice their statistics skills within real-world...
College Board
2011 AP® Calculus AB Free-Response Questions Form B
Half are real-world. The 2011 AP® Calculus AB free-response questions let pupils and teachers see how content appears on the exam. Half of the questions contain real-world context, and four items do not allow calculators. Real-world...
Curated OER
Math, Fractions, and Music
Students discover the relationship between musical rhythms and fractions. They add musical notes together to produce fractions and create addition and subtraction problems with musical notes. Students complete worksheets and create their...
K12 Reader
Elements & Atoms
Study matter in a new way with a cross-curricular assignment for language arts and math. Learners answer five reading comprehension questions after reading a few paragraphs about the periodic table, properties of elements, and how atoms...
K12 Reader
Classifying Triangles
Bring math and reading informational text together with a reading comprehension lesson. After kids read about isosceles, scalene, and equilateral triangles, they answer five comprehension questions to demonstrate how they can use context...
American Statistical Association
Confidence in Salaries in Petroleum Engineering
Just how confident can we be with statistics calculated from a sample? Learners take this into account as they look at data from a sample of petroleum engineer salaries. They analyze the effect sample size has on a margin of error and...
American Statistical Association
More Confidence in Salaries in Petroleum Engineering
Making inferences isn't an exact science. Using data about salaries, learners investigate the accuracy of their inferences. Their analyses includes simulations and randomization tests as well as population means.
Noyce Foundation
Granny’s Balloon Trip
Take flight with a fun activity focused on graphing data on a coordinate plane. As learners study the data for Granny's hot-air balloon trip, including the time of day and the distance of the balloon from the ground, they practice...
EngageNY
Magnitude
Build an understanding of the powers of 10. Pupils investigate the results of raising 10 to positive and negative powers. They relate this understanding to the magnitude these powers represent in this seventh lesson of 15.
Curated OER
Stock Market Math
Students calculate commission for a stock transaction through a broker using the relationship between percentages and decimals. They decide which stocks are preferable based on the price to earnings ratios listed on the stock market quotes.
Curated OER
Introduction to Flight: A Math, Science and Technology Integrated Project
Seventh graders review graphing procedures and practice locating points using x,y coordinates. Students calculate the areas of the top and bottom surfaces of the airfoil. They construct a test model of the airfoil.
Inside Mathematics
Graphs (2007)
Challenge the class to utilize their knowledge of linear and quadratic functions to determine the intersection of the parent quadratic graph and linear proportional graphs. Using the pattern for the solutions, individuals develop a...
Inside Mathematics
Marble Game
Pupils determine the theoretical probability of winning a game of marbles. Individuals compare the theoretical probability to experimental probability for the same game. They continue on to compare two different probability games.
EngageNY
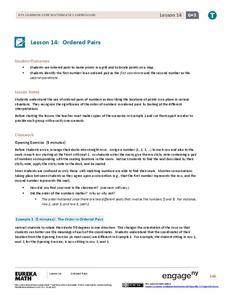
Ordered Pairs
Scholars learn to plot points on the coordinate plane. The lesson introduces the idea that the first coordinate of a coordinate pair represents the horizontal distance and the second coordinate represents the vertical distance.
EngageNY
Sampling Variability in the Sample Mean (part 2)
Reduce variability for more accurate statistics. Through simulation, learners examine sample data and calculate a sample mean. They understand that increasing the number of samples creates results that are more representative of the...
Curated OER
Problem Solvers
Fifth and sixth graders compare decimals to the place-value structure in the base-ten number system. They represent fractions as parts of unit wholes, as parts of a set, as locations on a number line, and as divisions of whole numbers....
Charleston School District
Graphs of Linear Functions
What does a slope of 2/3 mean? Develop an understanding of the key features of a linear function. Pupils graph the linear functions and explain the meaning of the slope and intercepts of the graphs.
Mathematics Assessment Project
Sugar Prices
Sugar rush! In this assessment task, learners interpret points on a scatter plot representing price versus weight for bags of sugar. They then determine the bag that represents the best value.
College Board
2009 AP® Calculus BC Free-Response Questions Form B
Let them eat cake. The free-response questions from an AP® Calculus BC exam cover several topics that include finding the area under a curve within the context of creating a birthday cake. Calculus concepts include finding rates of...
Curated OER
How Big is Big?
Geography learners compare and contrast population densities throughout the world. Using maps, they estimate the relative size of the world's regions and populations. They develop analogies to discover the world they live in and...
Doing Maths
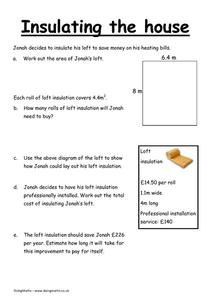
Insulating the House
Finding the area of a rectangle is the focus of this metric worksheet. Here, mathematicians use their knowledge of finding the area of a shape in meters to discover how much material can fit inside a shape.


