DK Publishing
Subtracting Big Numbers
Do your third graders get nervous when working with larger numbers? Help them get some practice subtracting big numbers in different contexts. After working through twenty-two straightforward problems, four of which include units of...
Illustrative Mathematics
Video Game Scores
Eric and Leila's video game scores are the inspiration for writing equations with parenthesis. The numbers are purposefully large to deter the class from calculating them: rather this activity meets the standard that asks 5th graders to...
Actis
Handling Data: Probability, Tree Diagrams
Clean, but captivating, two online simulations demonstrate probability for middle schoolers. They can choose the number of coins and tosses and watch as the results pile up. They can choose from a variety of spinner types and the number...
Curated OER
How Gear Systems Work: A Research Project
Students apply information regarding simple machines along with the math concept "ratios." The teacher introduces the concept that technology is the application of scientific knowledge and mathematics concepts to solve a problem. This is...
Alabama Learning Exchange
Polygons-Changing Area Versus Changing Perimeter
Investigate the area and perimeter of polygons in this geometry lesson. Young geometers use grid paper to draw a quadrilateral and calculate its area and perimeter. They also read The Greedy Triangle to identify the changing shape of...
Curated OER
Fractions, Decimals, and Percentages Got You Down? "Tri" This!
Students explore number sense by creating a math presentation in class. For this parts of a whole lesson, students define and discuss the relationship between fractions, decimals and percentages before completing a problem worksheet in...
Curated OER
A Handy Measure
How many hands tall are you? Challenge kids to measure themselves the way the 19th century Oklahoma horse traders measured their prize horses (can they guess how many hands tall a horse had to be?). There's some background information...
EngageNY
Modeling Relationships with a Line
What linear equation will fit this data, and how close is it? Through discussion and partner work, young mathematicians learn the procedure to determine a regression line in order to make predictions from the data.
EngageNY
Comparing Linear and Exponential Models Again
Making connections between a function, table, graph, and context is an essential skill in mathematics. Focused on comparing linear and exponential relationships in all these aspects, this resource equips pupils to recognize and interpret...
EngageNY
Solving Exponential Equations
Use the resource to teach methods for solving exponential equations. Scholars solve exponential equations using logarithms in the twenty-fifth installment of a 35-part module. Equations of the form ab^(ct) = d and f(x) = g(x) are...
EngageNY
Percent Rate of Change
If mathematicians know the secret to compound interest, why aren't more of them rich? Young mathematicians explore compound interest with exponential functions in the twenty-seventh installment of a 35-part module. They calculate future...
EngageNY
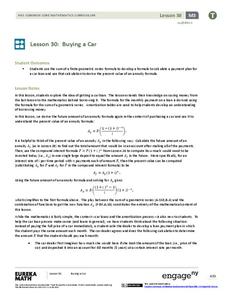
Buying a Car
Future car owners use geometric sums to calculate payments for a car loan in the 31st installment of a 35-part module. These same concepts provide the basis for calculating annuity payments.
EngageNY
An Appearance of Complex Numbers 1
Complex solutions are not always simple to find. In the fourth lesson of the unit, the class extends their understanding of complex numbers in order to solve and check the solutions to a rational equation presented in the first lesson....
Curated OER
Bar Graphs
What are these bar graphs depicting? Novice data analyzers examine two basic bar graphs and answer three comprehension questions about each. The first graph shows tickets sold per date and the next is distances run per member of a cross...
Curated OER
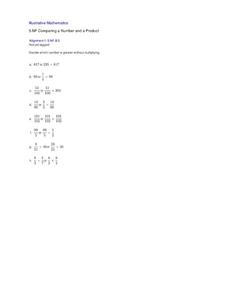
Comparing a Number and a Product
Mental math strategies are important for fifth graders to be able to determine the greater sum without actually solving the equations. As a summative assessment, this eight-problem instructional activity can give insight into the...
Illustrative Mathematics
Running Laps
If you run more laps, did you run further? Well, it depends. If the laps are different lengths, you need to do some math to answer that question. The goal of this task to is compare two fractions. Young learners represent the real-world...
Illustrative Mathematics
Cell Phone Plans
Turn your classroom into a local cell phone store. Then, have your cell phone agents use linear equations to visually display three cell plans and their advantages. It makes for a great group project. Discuss how to decide which plan is...
Curated OER
Prime and Composite Numbers
Prime and composite numbers are the focus of this mathematics lesson. In it, learners practice techniques for identifying these two types of numbers. They utilize the Inspiration program to complete a task that is clearly explained, and...
Curated OER
Penny Basketball: Making Sense of Data
Explore four web-based interactive sites to develop a baseline understanding of statistics. Learners play a series of penny basketball games and collect data regarding their shooting statistics. Groups decide who is the "top" penny...
Curated OER
Cross Cultural Transportation and Resources Exchange
Learners examine various modes of transportation. They explore regional transportation options and discover options available in their area. Students survey types of transportation people use in their area. Using spreadsheet data,...
Curated OER
Ratios And Scale
students investigate the concept of using a ratio in the work of construction and solve problems using real life applications. They read descriptions of how various types of construction professionals use ratios on the job. The lesson...
Curated OER
Ratios, Rates, Percent and Nutrition
Examine food labels to determine percentage of fat and sugar to total calories with middle schoolers. Daily nutritional guidelines are discussed and learners will decide how well their foods fit into a healthy diet. In the provided...
Curated OER
It Counts
Students classify and compare plants using specific information, observations, and numbers. For this mathematical inquiry lesson, students use plant characteristics to describe, compare, and classify them. They attempt to develop a...
Curated OER
The Three M's of Statistics: Mode, Median, Mean
Young mathematicians use the Visual Thesaurus to define mean, median, and mode. In this mean, median and mode lesson plan, learners use online sources to find the definitions of mean, median, and mode before applying the concepts to a...


