EngageNY
From Ratio Tables to Double Number Line Diagrams
How much sugar is in one bottle? Pupils use double number line diagrams to determine the amount of sugar in a 1L bottle of cola. The teacher leads a discussion on ways that double number lines can be of assistance in solving a...
EngageNY
The Structure of Ratio Tables—Additive and Multiplicative
Build tables by understanding their structure. Scholars take a closer look at the structure of ratio tables in the 10th segment in a 29-part series. Individuals realize that the tables can be built using an additive or...
Mathed Up!
Two Way Tables
When presented with categorical data, a two-way frequency table is a great way to summarize the information. Pupils organize categorical data using a two-way table, then use the tables to determine missing data and to calculate simple...
Math Stars
Math Stars: A Problem-Solving Newsletter Grade 6
Think, question, brainstorm, and make your way through a newsletter full of puzzles and word problems. The resource includes 10 different newsletters, all with interesting problems, to give class members an out-of-the box...
EngageNY
Tables of Equivalent Ratios
Don't table the discussion on equivalent ratios — do it now! Scholars create tables of equivalent ratios to represent contextual problems. Pupils go on to use the tables to answer questions within the context. The instructional activity...
EngageNY
Comparing Ratios Using Ratio Tables
Decide which concentration of mixtures is the strongest. Pupils use tables to compare ratios involved in mixtures. They use two methods to make the comparisons — by finding equivalent values within the tables or by comparing the...
Curated OER
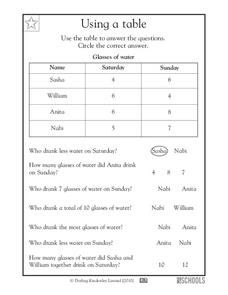
Using a Table
Tables are no help if your scholars can't read them; provide some excellent beginner-practice using this table example and accompanying comprehension questions. Learners examine the data first, which charts the number of glasses of water...
Mathed Up!
Frequency Tables
The section of a larger General Certificate of Secondary Education math review requires pupils to summarize numerical data presented in a frequency table. Scholars determine the number of data points, the range, the mean, and the...
EngageNY
From Ratio Tables to Equations Using the Value of a Ratio
Use the value of a ratio to set up equations. The teacher leads a discussion on determining equations from ratio tables in the 13th portion of a 29-part series. Pupils determine which of two equations to use to find the solution....
Inside Mathematics
Conference Tables
Pupils analyze a pattern of conference tables to determine the number of tables needed and the number of people that can be seated for a given size. Individuals develop general formulas for the two growing number patterns and...
DK Publishing
Using Information in Tables
Find out how well can your second or third graders use tables to solve word problems by assigning this single-page activity. Two tables with different sets of data prompt learners to solve six problems. An example at the top of the page...
Curated OER
Make a Table
First and second graders participate in an experiment then create a table of tally marks to identify the totals. They problem solve, tally twenty experiences, and generate an answer to one question.
Math Worksheets Land
Patterns of Association (Using Data Table) - Matching Worksheet
This resource is the last of a four-part series that practices calculating percents based on data represetned in tables. This page has four multiple choice problems that analyze the data tables to answer a question.
Math Worksheets Land
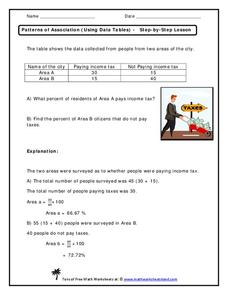
Patterns of Association (Using Data Tables) - Step-by-Step Lesson
This worksheet belongs to a four-part resource that gathers information from data tables to calculate percentages. The page introduces one problem and shares an explanation to the answer.
Charleston School District
Graphing Functions
How do letters and numbers create a picture? Scholars learn to create input/output tables to graph functions. They graph both linear and nonlinear functions by creating tables and plotting points.
Balanced Assessment
Sales Tax Table
Sales tax rates vary; do the math to find the right rate! Pupils use before tax amounts and after tax amounts to determine the tax rate. Rounding makes the task challenging.
Illustrative Mathematics
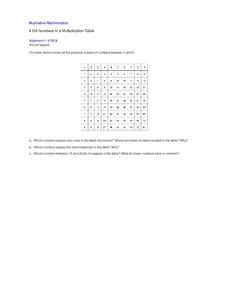
Numbers in a Multiplication Table
Identifying patterns is a crucial skill for all mathematicians, young and old. Explore the multiplication table with your class, using patterns and symmetry to teach about square numbers, prime numbers, and the commutative and identity...
Mathematics Assessment Project
Table Tiling
How many total tiles does it take to tile a table top? Learners apply geometric concepts to determine the number of tiles needed for a specific square table top, and then use the result to create expressions for the number of tiles...
Curated OER
Making Money and Spreading the Flu!
Paper folding, flu spreading in a school, bacteria growth, and continuously compounded interest all provide excellent models to study exponential functions. This is a comprehensive resource that looks at many different aspects of...
EngageNY
Mid-Module Assessment Task: Grade 6 Math Module 2
Make sure scholars know all about fractions and decimals — not just a fraction of the information. The 12th installment of a 21-part series is a mid-module assessment. Learners solve problems in the context of a birthday party and a...
Curated OER
Making Predictions from Data with a Graphing Calculator
In this making predictions from data instructional activity, students solve 15 short answer problems. Students determine average miles per gallon given data on miles traveled and gas used. Students make predictions using the data and a...
Curated OER
Sunshine Math- 2 Earth, VII
In this math activity, students solve 8 varied problems that include: making tables, circle graphs, choosing the sign, finding angles in pictures, and estimation.
Noyce Foundation
Ducklings
The class gets their mean and median all in a row with an assessment task that uses a population of ducklings to work with data displays and measures of central tendency. Pupils create a frequency chart and calculate the mean and median....
EngageNY
Creating a Dot Plot
Which dot am I? Pupils create dot plots to represent sample data through the use of frequency tables. The third segment in a series of 22 asks individuals to analyze the dot plots they created. The scholars translate back and...


