Project Maths
Trigonometric Functions
From a circle to a cycle! The final activity of a five-part series challenges learners to use points from the unit circle to plot a repeating pattern. The repeating patterns become the graphs of the trigonometric functions. Scholars...
Improving Measurement and Geometry in Elementary Schools
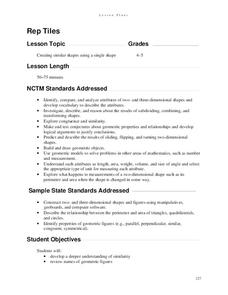
Rep Tiles
In addition to the catchy title, this lesson plan provides upper graders an opportunity to more closely scrutinize the attributes of plane figures. In particular, they focus on the similarity of different shapes. Both whole-class and...
Alabama Learning Exchange
Place Value Review
Here is a fast-paced addition game which reinforces the concept of place values. Learners view a PowerPoint on place value, then engage in the game using a whole-class format. This is a stimulating, and interesting math game activity.
Curated OER
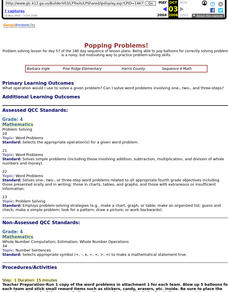
Popping Problems!
Turn your math instructional activity into a carnival game with this fun, outdoor activity. After reviewing the concept your class will be practicing briefly, split your class up into teams and head outdoors. These teams work to solve...
Teach Engineering
Weather Forecasting
According to the Farmers' Almanac, the weather will be nice today. Class members examine how weather forecasting plays a part in their lives with a resource that provides information on the history of forecasting, from using cloud...
Curated OER
Exponential Expressions - Perfect Squares, Square Roots
Color tiles are used to model perfect squares. Alone or in pairs, middle schoolers will find patterns. Afterward, the relationship between perfect squares and roots will be discussed as a whole class.
Curated OER
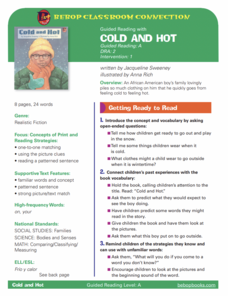
Guided Reading: Cold and Hot
Explore the text, Cold and Hot, with comprehension strategies for young readers. First, give them a purpose for reading: find out what the boy wore outside in the snow! Then have them use one-to-one matching and picture clues to...
American Statistical Association
How Tall and How Many?
Is there a relationship between height and the number of siblings? Classmates collect data on their heights and numbers of brothers and sisters. They apply statistical methods to determine if such a relationship exists.
Curated OER
Another Way of Factoring
Focusing on this algebra lesson, learners relate quadratic equations in factored form to their solutions and their graph from a number of different aspects. In some problems, one starts with the original equation and finds the...
EngageNY
Comparing Linear and Exponential Models Again
Making connections between a function, table, graph, and context is an essential skill in mathematics. Focused on comparing linear and exponential relationships in all these aspects, this resource equips pupils to recognize and interpret...
Norm Mitchell
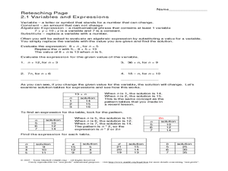
Reteaching Page 2.1 Variables and Expressions
The vocabulary for working with variable is expressions is listed at the top of this handout. Prealgebra pros evaluate four expressions when a value is assigned to the variables. Then an explanation is given about how changing the value...
American Statistical Association
Scatter It! (Predict Billy’s Height)
How do doctors predict a child's future height? Scholars use one case study to determine the height of a child two years into the future. They graph the given data, determine the line of best fit, and use that to estimate the height in...
Curated OER
Did Voters Turn Out -- or Are They Turned Off?
What was the voter turnout at your last state election? Examine voter turnout statistics from the most recent election to learn which ten states have the best turnout record. This lesson offers election data, handouts, and worksheets.
Curated OER
Skate Party
Learners use the Frayer model during problem solving. In this problem solving lesson, they examine multiple methods of data collection to solve real world problems. Resources are provided.
Curated OER
Exploring Expressions
Examine parts of an expression in this algebra lesson. Ninth graders identify the properties of the coefficient and their behavior to the graph. They graph the equation on a TI to see their results.
American Statistical Association
You and Michael
Investigate the relationship between height and arm span. Young statisticians measure the heights and arm spans of each class member and create a scatter plot using the data. They draw a line of best fit and use its slope to explain the...
Alabama Learning Exchange
Introduction to Division
Examine how addition, subtraction, multiplication, and division relate to and are separate from each other. As they listen to the book, The Doorbell Rang, they demonstrate the math described in the story by cutting up paper cookies...
Visa
Making Spending Decisions
By role playing real-world experiences, such as purchasing snacks and grocery/toy store shopping, your youngsters will begin to develop an understanding of how to make decisions and choose between alternatives. This is the first...
Kentucky Educational Television
The Road to Proportional Reasoning
Just how big would it really be? Young mathematicians determine if different toys are proportional and if their scale is accurate. They solve problems relating scale along with volume and surface area using manipulatives. The...
Curated OER
Multiplication
Learners practice their multiplication facts by reinforcement and repetition. Students write facts in their math journals, and use labeled soccer ball and deck of cards to practice multiplying by "number of the day." Play continues until...
Utah Education Network (UEN)
Geo Shapes
Invite your first graders to compose and decompose two and three-dimensional figures with this fun, hands-on lesson. They investigate and predict the results of putting together and taking apart two-dimensional shapes with rubber bands...
Illustrative Mathematics
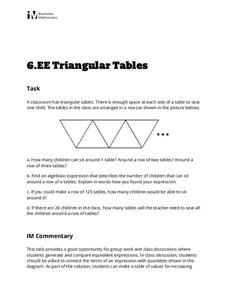
Triangular Tables
Somewhat of a puzzle, this problem gets pre-algebra preteens to write an expression representing a seating chart using triangle-shaped tables. This single task is an applicable lesson for meeting sixth grade Common Core math standards....
Curated OER
Poly-Mania
This hands-on instructional activity takes young geometers on a tour of 2D polygons and 3D polyhedrons. After exploring different web resources and discussing geometric shapes, small groups construct models of polyhedrons using bendable...
Google
Surveys and Estimating Large Quantities
Looking for an estimation activity a bit more involved than the typical "guess the number of jellybeans in the jar" game? Here, learners use a picture to estimate the number of people at a large event, look for potential problems with...
