Concord Consortium
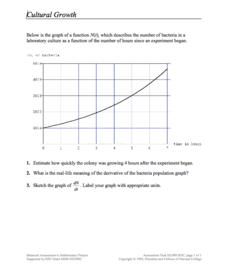
Cultural Growth
Scholars read and interpret a graph relating bacterial growth in a culture over time. They apply knowledge of derivatives, estimation, and graphing to the skill practice questions.
Concord Consortium
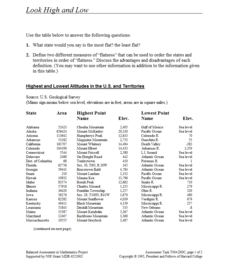
Look High and Low
From the highest high to the lowest low here's a resource that won't fall flat. Given data on the area and the highest and lowest elevations of each of the 50 states, learners decide which states are the least flat and the most flat. Of...
California Education Partners
Lashelles Garden
Let knowledge grow bountifully like plants in a garden. Given a diagram of a rectangular garden split into plots, scholars determine the area of the entire garden and the areas of the individual plots. As a culminating activity, they...
World Wildlife Fund
Graphs and Charts
A two-part activity incorporating bar graphs and pie charts, young mathematicians can practice their graphing skills. Pupils answer questions using graphs and charts but are also challenged to create their own using a given set of data.
Mathematics Vision Project
Quadratic Functions
Inquiry-based learning and investigations form the basis of a deep understanding of quadratic functions in a very thorough unit plan. Learners develop recursive and closed methods for representing real-life situations,...
Mathematics Vision Project
More Functions, More Features
Learners tackle a wide range of intimidating topics in this comprehensive unit that spans piecewise functions, absolute value of functions, and inverse functions (among other topics). Investigative group work alternates with more...
Illustrative Mathematics
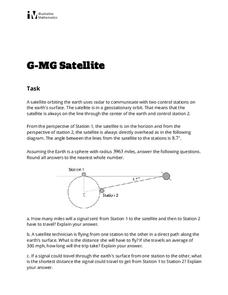
Satellite
Learners practice relating rules of trigonometry and properties of circles. With a few simplifying assumptions such as a perfectly round earth, young mathematicians calculate the lengths of various paths between satellite and...
Illustrative Mathematics
Solar Eclipse
Learners take on the role of astronomers, calculating conditions necessary for a total solar eclipse. Concepts of similar triangles and properties of circles come together as pupils create ratios and use real measurements in determining...
Southwestern Medical Center
Field Epidemiology: Investigation of an Unknown Disease
More than 90 percent of the people in a building have come down with an illness, and it is your job to investigate. Teachers give scientists the data needed to decide what is important and how they can solve the mystery....
Chymist
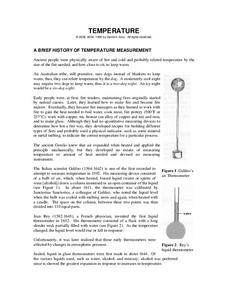
Temperature
Three Dog Night isn't just the name of a band; it is also the way an Australian tribe, who used dogs to stay warm, would describe the temperature on a cool evening. After reading about many different ways of measuring temperature, the...
Mathematics Assessment Project
Designing a 3d Product in 2d: a Sports Bag
Sew up pupil interest with an engaging, hands-on lesson. Learners first design a sports bag given constraints on the dimensions of fabric. They then evaluate provided sample responses to identify strengths and weaknesses of included...
Mathematics Assessment Project
Sampling and Estimating: Counting Trees
Your task today: count all the trees on a tree farm. To complete the assignment, learners first estimate the number of trees on a tree farm using random sampling. To improve their own response they then evaluate provided...
Balanced Assessment
Solar Elements
Let your brilliance shine like the sun. Future mathematicians and scientists consider given data on the abundance of different elements in the sun. The assessment task requires consideration of how these different abundances relate to...
California Mathematics Project
Model Solar System
The sun's diameter is 864,337 miles—challenge learners to create a scale model of the solar system that fits in your classroom. Scholars make conversions and work with scientific notation as they create the scale model.
Statistics Education Web
Double Stuffed?
True or false — Double Stuf Oreos always contain twice as much cream as regular Oreos. Scholars first measure the masses of the filling in regular Oreos and Double Stuf Oreos to generate a class set of data. They use hypothesis testing...
Statistics Education Web
Are Female Hurricanes Deadlier than Male Hurricanes?
The battle of the sexes? Scholars first examine data on hurricane-related deaths and create graphical displays. They then use the data and displays to consider whether hurricanes with female names result in more deaths than hurricanes...
Statistics Education Web
How Wet is the Earth?
Water, water, everywhere? Each pupil first uses an Internet program to select 50 random points on Earth to determine the proportion of its surface covered with water. The class then combines data to determine a more accurate estimate.
Radford University
A Change in the Weather
Explore the power of mathematics through this two-week statistics unit. Pupils learn about several climate-related issues and complete surveys that communicate their perceptions. They graph both univariate and bivariate data and use...
California Mathematics Project
Meteorology
See how estimation is essential to making temperature weather maps. Scholars use ratios and rates of change to estimate temperatures at locations where temperature readings have not been made. They connect this idea to linear functions.
McGraw Hill
Escape Velocity Interactive
How hard do you need to throw a ball in the air so that it never returns? Scientists call this measure the escape velocity. Classes can explore this concept through an intriguing interactive lesson. Pupils adjust velocities and observe...
CK-12 Foundation
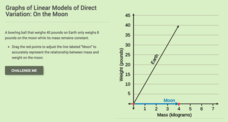
Graphs of Linear Model of Direct Variation: On the Moon
You'll be over the moon about this resource. Scholars draw a line representing the weight of an object on the moon based on its mass. Consideration of the constant of proportionality allows them to see relationships between weight of an...
CK-12 Foundation
The Real Numbers: Adding Electrons
Get a charge out of a great resource! Scholars use an interactive to explore addition and subtraction of integers. They add or remove electrons in an atom model to consider its charge.
West Contra Costa Unified School District
Average Rate of Change
The concept of slope gets an approachable, yet theoretical, treatment in a comprehensive algebra lesson. The use of functional notation and problem-solving techniques keep the material rigorous, but detailed teaching notes and lots of...
Howard Hughes Medical Institute
Virus Explorer
Most pupils know about the flu, HIV, and other viruses, but they don't know what each actually looks like. This interactive shows their relative size, structure, and allows for comparisons. It stresses the similarities and differences...
Other popular searches
- Math and Science Careers
- Integrated Math and Science
- Science and Math
- Science/ Math Games
- Math and Science Activities
- Integrating Math and Science
- +Math and Science Careers
- Math and Science Plan
- Math and Science Lessons
- Word Origins Science Math
- Math in Science Experiments
- Science Math
