Curated OER
Just Me and My Shadow
Students take measurements throughout the day using a simple sundial called a gnomon. They record the results on a Data Log and convert from English units to metric (S.I.) units. Data points are plotted on the same graph and analyzed.
Mathematics Assessment Project
Estimating Length Using Scientific Notation
Would you rather have a million dollars or 1 x 10^6 dollars? To find the answer to this question, class members first complete an assessment task converting numbers between decimal notation and scientific notation. They then take...
Curated OER
A Mass of Pennies
Learners estimate and determine the number of cents (pennies) that are needed to equal the mass of a variety of common objects. They develop a process for measuring and explore concepts related to units of measurement.
Alabama Learning Exchange
Abundant Area
Explore the relationship between perimeter and area. Learners input the area and perimeter for shapes on the Shape Explorer website, solve problems using geoboards, complete a worksheet, create a PowerPoint presentation, and take an...
Curated OER
Getting it Right! An Investigation of the Pythagorean Theorem
In order to learn about the Pythagorean Theorem, young mathematicians investigate relations and patterns between different sides of a right triangle to look for possible relations among the squared sides. Once they have established the...
Curated OER
Build Your Dream Bedroom
Designers measure their own rooms and produce a scale drawing. They use the Internet to visit sites to find the costs of purchasing new carpet, paint, or anything else they would like to add to their room. Using a $1500 budget, they will...
Curated OER
Density - An Intrinsic Property
Learners discover the property of density while participating in a lab exercise. In this scientific measuring lesson plan, pupils utilize a scale to measure the density of different metal materials. They document their work and present...
Curated OER
Area and Perimeter Floor Plan
Using Google SketchUp, learners draw a model of their bedroom. They begin by measuring the dimensions of their bedroom, inputting this information into the software program, and calculating perimeter and area. This is an interesting and...
EngageNY
End-of-Module Assessment Task - Algebra 1 (Module 2)
Check for understanding at the end of your descriptive statistics unit with an end-of-module assessment. It uses five questions to measure progress toward mastery of descriptive statistics standards. Each question is developed...
American Statistical Association
You and Michael
Investigate the relationship between height and arm span. Young statisticians measure the heights and arm spans of each class member and create a scatter plot using the data. They draw a line of best fit and use its slope to explain the...
American Statistical Association
What is the Probability of “Pigging Out”
Learners apply their understanding of luck to a probability experiment. They play a game of Pass the Pigs to determine the probability of a specific outcome. Using analysis for their data, pupils declare the measures of center, dot...
Texas Instruments
Drawing a Line Tangent to a Circle
Explore lines tangent to a circle. In this math lesson plan, students manipulate circles and lines on a TI calculator. They draw a circle and analyze perpendicular lines intersecting the circle in only one place. This activity...
Curated OER
Skittles Galore!
Youngsters show understanding of accurate division of whole number, decimals, fractions, and percents using manipulatives (candies). They use white boards to demonstrate their understanding of representing numbers as defined in the...
Alabama Learning Exchange
Dog Gone Again!
Here is a real-life lesson plan! Learners must plan the dimensions of a rectangular fence to reign in a runaway dog. They survey what shape and size fence is needed and use formulas to find perimeter and area of the fence. They explore...
Curated OER
Statistics Canada
Students practice using graphing tools to make tables, bar charts, scatter graphs, and histograms, using census data. They apply the concept of measures of central tendency, examine the effects of outliers. They also write inferences and...
Balanced Assessment
Blirts and Gorks
Start a trend by using blirts and gorks as your standard unit of measures. The activity asks learners to take a known measures of blirts and gorks and develop a conversion ratio. Individuals use both perimeter and area measures of...
Curated OER
Supplementary, Complementary, and Vertical Angles
By using circles that they cut out and label themselves, learners literally "get a grip" on the angles they identify: supplementary, complementary, and vertical. They solve missing measurements based on properties of supplementary,...
Alabama Learning Exchange
What You Know About the Bermuda Triangle?
Get lost in the classifications. Using the backdrop of the Bermuda Triangle, pupils classify it by angle and side measures. They also learn information about the triangle and its history.
Curated OER
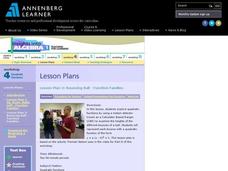
Bouncing Ball : Function Families
A bouncing ball serves as more than entertainment when learning to apply quadratic functions to real-world events. This is the second of a two-part lesson, which can also be accessed from the website. The instructions say to measure the...
Mathematics Assessment Project
Maximizing Area: Gold Rush
Presenting ... the gold standard for a lesson. Learners first investigate a task maximizing the area of a plot for gold prospecting. They then examine a set of sample student responses to evaluate their strengths and weaknesses.
Alabama Learning Exchange
Time to Tell Time
Students demonstrate how to tell time using an analog clock. In this time measurement lesson, students read the book Clocks and More Clocks and use analog clocks to demonstrate the time that the teacher called out.
Utah Education Network (UEN)
Linear Graphs Using Proportions and Rates
Using a TI-73 or other similar graphing calculator middle school math majors investigate the linear relationship of equivalent proportions. After a brief introduction by the teacher, class members participate in a timed pair share...
Curated OER
Similarity and Dilations - Discover Properties of Similar Figures
Learners investigate properties of similar figures. For this properties of similar figures lesson, pupils construct similar figures using Cabri Jr. They dilate their figure to create a similar one, and discuss the relationships between...
Statistics Education Web
It’s Elemental! Sampling from the Periodic Table
How random is random? Demonstrate the different random sampling methods using a hands-on activity. Pupils use various sampling techniques to choose a random sample of elements from the periodic table. They use the different samples to...


