Virginia Department of Education
Mathematics Vocabulary Cards - Grade 2
Augment your math curriculum with posters detailing several concepts important to second grade math. Each poster features one math term from geometry, measurement, probability and statistics, computation and estimation, numbers and...
Yummy Math
Which Sweet Heart Candy Is the Best Deal?
Get the most Valentine's candy for your money with a fun math activity! After examining three deals for buying candy hearts in bulk, young mathematicians decide which deal is the best and use bar graphs to demonstrate their claim. They...
Mathematics Assessment Project
Shelves
Don't leave this task on the shelf — use it is assess middle schoolers understanding of patterns. Participants try to discover a pattern in the number of bricks and planks used to make shelves. They then match descriptions...
EngageNY
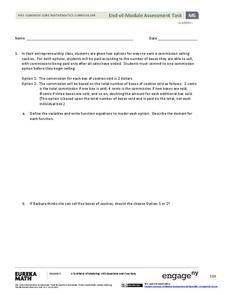
End-of-Module Assessment Task - Algebra 1 (Module 5)
This unit assessment covers the modeling process with linear, quadratic, exponential, and absolute value functions. The modeling is represented as verbal descriptions, tables, graphs, and algebraic expressions.
Concord Consortium
Rational and Not So Rational Functions
Do not cross the line while graphing. Provided with several coordinate axes along with asymptotes, pupils determine two functions that will fit the given restrictions. Scholars then determine other geometrical relationships of asymptotes...
Mathematics Assessment Project
Comparing Lines and Linear Equations
Scholars first complete an assessment task on writing linear equations to model and solve a problem on a running race. They then take part in a card matching activity where they match equations and graphs of lines to diagrams of fluid...
Mathematics Vision Project
Module 9: Modeling Data
How many different ways can you model data? Scholars learn several in the final module in a series of nine. Learners model data with dot plots, box plots, histograms, and scatter plots. They also analyze the data based on the data...
EngageNY
Why Call It Tangent?
Discover the relationship between tangent lines and the tangent function. Class members develop the idea of the tangent function using the unit circle. They create tables of values and explore the domain, range, and end behavior of...
Balanced Assessment
Telephone Service
Class members must determine the best phone plan for customers. by assessing three different phone plans. Each plan price depends not only the number of minutes, but also the location of the calls — bringing in a third variable. Scholars...
Curated OER
Mathematical Treasure Hunt
The hunt is on! Young mathematicians follow clues and complete a series of ten math puzzles as they try to crack Dr. Integer's code and find the location of his hidden treasure.
Curated OER
Monster Data
An inventive lesson shows learners how to collect, organize, and present mathematical data. They access websites which lead them through a variety of ways to engage in data collection. They get to design and create graphs, and present...
National Security Agency
Are You Ready to Call the Guinness Book of Records?
Learners design questions that can be answered by collecting data. In this line-plot lesson, pupils collect data and graph on a line plot on world records. An abundant supply of teacher support is provided in this resource.
North Carolina State University
Exploring Genetics Across the Middle School Science and Math Curricula
Where is a geneticist's favorite place to swim? A gene pool. Young geneticists complete hands-on activities, experiments, and real-world problem solving throughout the unit. With extra focus on dominant and recessive genes, Punnett...
Curated OER
Graphing From Function Tables
In this graphing from function tables worksheet, students graph given functions from a completed function table. This is a worksheet generator, the teacher can set the grid size for plotting points as well as whether or not to include a...
Curated OER
Graphing Applications
In this graphing applications worksheet, learners derive equations for 4 word problems. Students then define variables, find intercepts, graph the equations, and interpret the slopes.
Curated OER
Graphing
In this algebra worksheet, students make a table and graph their linear equations. There are 4 problems to be solve by find x and y values.
Curated OER
Organizing Data Using Tables and Graphs
Learners create graphs and tables, as well as interpret and make inferences from the data shown to determine when and where graphs and tables are most useful.
Curated OER
Long Distance Phone Plans
In this long distance phone plane worksheet, students compare various phone plans and determine which long distance plan has the greatest savings. Students support their answers visually through the use of tables and graphs. They write...
Curated OER
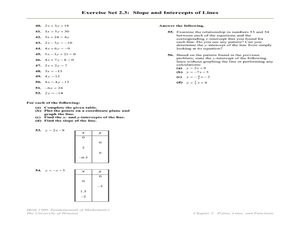
Slope, Intercepts, and Graphing a Line
In this intercepts and slope worksheet, learners find the slope and/or the x and y-intercepts in fifty-three problems. Students also graph lines using the x and y-intercepts.
Curated OER
Graphing and Analyzing
In this graphing and analyzing worksheet, 9th graders first state if each graph represents a linear or nonlinear relationship. Second, they create a difference table for each set of data presented and determine whether it represents a...
Curated OER
Problem-Solving Application: Make a Circle Graph
In this circle graphs instructional activity, students analyze a data table about the activities in a day. Students then use this data to make a circle graph. Students answer 6 questions about the graph.
Curated OER
Graphing Ordered Pairs
Here is graphing worksheet which has pupils graph ordered pairs and label the axis. They graph five ordered pairs and then interpret the data in the graph.
Curated OER
Graphs of Formulas
In this worksheet students fill out a function table after reading a short word problem. This is a good way for students to practice the necessary skills for solving word problems or setting up algebra equations.
Curated OER
Line Graphs
In this line graphs worksheet, 8th graders solve and complete 20 different problems that include reading various line graphs. First, they use the information provided in each line graph to determine the correct response to each of the...


