Curated OER
Figuring Elapsed Time
Students discover the concept of elapsed time. In this calculating time lesson plan, students utilize the Internet to complete record sheets based on the concept of elapsed time. Finally, the students answer questions on their own.
Curated OER
Worksheet 2: Graphs, Functions and Derivatives
In this math worksheet, young scholars answer 7 questions having to do with graphing derivatives of functions, rectilinear motion, speed and distance.
EngageNY
Graphs of Simple Nonlinear Functions
Time to move on to nonlinear functions. Scholars create input/output tables and use these to graph simple nonlinear functions. They calculate rates of change to distinguish between linear and nonlinear functions.
EngageNY
Square Roots
Investigate the relationship between irrational roots and a number line with a resource that asks learners to put together a number line using radical intervals rather than integers. A great progression, they build on their understanding...
Curated OER
Worksheet 14: Properties of Logs
In this math worksheet, students are given 7 problems in which they review properties of logs and solve, differentiate formulae, find derivatives and solve story problems involving the rate of spread of a disease and Newton's Law of...
Virginia Department of Education
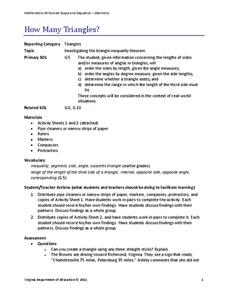
How Many Triangles?
Something for young mathematicians to remember: the sum of any two sides must be greater than the third. Class members investigates the Triangle Inequality Theorem to find the relationship between the sides of a triangle. At the...
NYSU
Understand a Fraction as a Number on a Number Line
Piece by piece young scholars build a basic understanding of fractions in a Common Core-designed elementary math lesson. Through a series of hands-on activities and journaling exercises, and with the help of multiple...
Curated OER
Acceleration Lab
Young Einsteins experiment with the acceleration of Hot Wheels™ toy cars down inclined planes at various angles. This classic physics lab activity is thoroughly explained in both a teacher’s guide and a student lab sheet. Science...
EngageNY
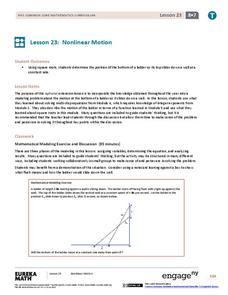
Nonlinear Motion
Investigate nonlinear motion through an analysis using the Pythagorean Theorem. Pupils combine their algebraic and geometric skills in the 24th lesson of this 25-part module. Using the Pythagorean Theorem, scholars collect data on the...
Curated OER
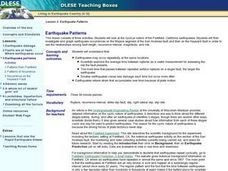
Earthquake Patterns
Students identify and interpret the cyclical nature of the Parkfield, California earthquakes. They then investigate and graph earthquake occurrences on the Mojave segment of the San Andreas fault and then on the Hayward fault in order to...
Curated OER
What Time Does the Last Worker Report?
Third graders explore the concepts of time and consumer goods. In this telling time lesson, 3rd graders respond to questions about the passage of time and goods and services. This lesson incorporates the use a video titled...
EngageNY
Constant Rates Revisited
Find the faster rate. The resource tasks the class to compare proportional relationships represented in different ways. Pupils find the slope of the proportional relationships to determine the constant rates. They then analyze the...
Willow Tree
Histograms and Venn Diagrams
There are many different options for graphing data, which can be overwhelming even for experienced mathematcians. This time, the focus is on histograms and Venn diagrams that highlight the frequency of a range of data and overlap of...
Curated OER
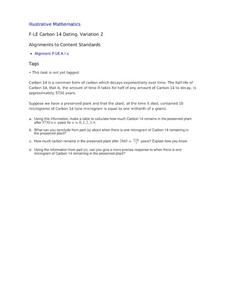
Carbon 14 Dating, Variation 2
Your archaeologists begin this task with a table of values to estimate the time passed based on the half-life of Carbon 14 remaining in a plant. They then move on to find when a specific amount of Carbon 14 is present in the same plant,...
EngageNY
Increasing and Decreasing Functions 2
Explore linear and nonlinear models to help your class build their function skills. In a continuation of the previous lesson, learners continue to analyze and sketch functions that model real-world situations. They progress from linear...
EngageNY
Two Graphing Stories
Can you graph your story? Keep your classes interested by challenging them to graph a scenario and interpret the meaning of an intersection. Be sure they paty attention to the detail of a graph, including intercepts, slope,...
Illustrative Mathematics
Velocity vs. Distance
At the end of this activity, your number crunchers will have a better understanding as to how to describe graphs of velocity versus time and distance versus time. It is easy for learners to misinterpret graphs of velocity, so have them...
EngageNY
Margin of Error When Estimating a Population Mean (part 1)
We know that sample data varies — it's time to quantify that variability! After calculating a sample mean, pupils calculate the margin of error. They repeat the process with a greater number of sample means and compare the results.
Statistics Education Web
What Does the Normal Distribution Sound Like?
Groups collect data describing the number of times a bag of microwave popcorn pops at given intervals. Participants discover that the data fits a normal curve and answer questions based on the distribution of this data.
Curated OER
In the Billions and Exponential Modeling
Modeling population growth gives learners an opportunity to experiment with real data. Comparing the growth rates in this real-life task strengthens learners' understanding that exponential functions change by equal factors over equal...
Curated OER
Worksheet 14
In this math worksheet, students analyze a path around a circle. The interval is defined. Students sketch a graph of a given parametric curve. Five application problems give students practice using these concepts in real life situations.
Curated OER
Graphs and Transformations of Functions
Is it possible to solve quadratic equations by factoring? It is, and your class will graph quadratic equation and functions too. They perform transformation on their graphs showing increasing and decreasing intervals, domain, and range....
Curated OER
Worksheet 15-Fall 1995
In this math worksheet students use the intermediate value theorem to solve two problems. They find parallel lines that will cut a convex shape into two pieces with equal areas. Students repeat this problem with a concave shape. Students...
Curated OER
Telling Time
Students tell time. In this ELL vocabulary development and math lesson, students orally tell time to five minute intervals when shown a classroom clock. Students practice using number and "telling time" vocabulary in sentences and...


