Illustrative Mathematics
What is a Trapezoid? (Part 2)
This collaborative activity investigates the meaning of a trapezoid and a parallelogram. It begins by presenting two different definitions of a trapezoid. Learners are to reason abstractly the difference between the two definitions and...
Kenan Fellows
Math Made Simple as 1-2-3: Simplified Educational Approach to Algebra
Writing an equation of a line is as easy as m and b. A lesson presentation gives individuals different strategies for writing equations of lines. Some items provide a slope and a point while others provide two points. Whatever the given,...
Illustrative Mathematics
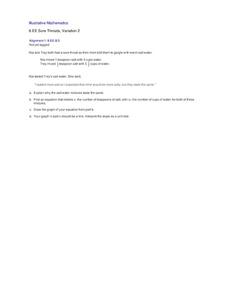
Sore Throats, Variation 2
What does math have to do with a sore throat? When you mix water and salt you have a great review of how to represent proportional relationships by an equation or graph. Here the proportions of the mixtures may be different, but the...
Curated OER
Which is Closer to 1?
A seemingly simple question that reveals a lot about a student's understanding of fractions. In finding an answer, learners compare fractions with different denominators that are both greater and less than one. No number line is...
Curated OER
Counting, Properties of Numbers, and Reasoning about Numbers
Five days of lessons develop number sense and counting patterns, including odd and even numbers, 5s and 10s, doubles, and ways to make 10. Each session opens with fun finger play to reinforce counting and reasoning about numbers. Various...
Illustrative Mathematics
How Many Containers in One Cup / Cups in One Container?
The object is to model fraction division by asking “How many are in one group?” It is a difficult concept to understand, but developing the model that shows one cup to a certain amount of container or one container to a certain amount of...
EngageNY
The Graph of a Linear Equation in Two Variables
Add more points on the graph ... and it still remains a line! The 13th installment in a series of 33 leads the class to the understanding that the graph of linear equation is a line. Pupils find several solutions to a two-variable linear...
American Statistical Association
Happy Birthday to . . . Two?
How many people do you need in a room before two likely share the same birthday? Scholars consider this puzzle by analyzing a set of data. They ponder how to divide the data and determine the proper size of a group for this event to...
EngageNY
Identifying Proportional and Non-Proportional Relationships in Tables
Learners determine whether there is a constant multiple within the table through an instructional activity that presents a method for determining whether two quantities are proportional. Pupils analyze tables to determine if they...
EngageNY
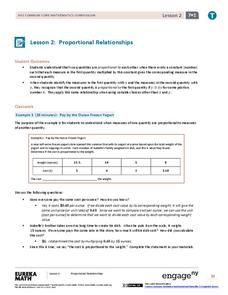
Proportional Relationships
Challenge the class to determine whether two quantities are proportional. The second lesson in a unit of 22 has class members decide if two quantities have a proportional relationship. If a proportional relationship exists, the pupils...
Curated OER
Inductive and Deductive Reasoning
Students use logical arguments and inductive reasoning to make or disprove conjectures. After observing a teacher led demonstration, students discover that the deductive process narrows facts to a few possible conclusions. In groups,...
Montana Office of Public Instruction
Native American Culture: Counting, 1:1 Correspondence
Kindergarteners practice showing 1:1 correspondence while incorporating information they learned about a local Native American culture. The objects used for counting are taken from the previous day's Native American lesson. The intention...
EngageNY
The Side-Angle-Side (SAS) and Side-Side-Side (SSS) Criteria for Two Triangles to Be Similar
Playing with mathematics can invoke curiosity and excitement. As pupils construct triangles with given criteria, they determine the necessary requirements to support similarity. After determining the criteria, they practice...
Curated OER
Introduce Double-Digit Addition
Students generate a list of numbers then classify them into groups of single digit and double-digit numbers. After listening to a children's book about double-digit addition, they work with tens and ones blocks to solve double-digit...
Curated OER
Pairs of Whole Numbers
Mathematical reasoning and linear systems are two of the strategies used to solve this number puzzle. Your learners will enjoy the challenge and the variety of ways to approach this challenge.
EngageNY
Calculating Conditional Probabilities and Evaluating Independence Using Two-Way Tables (part 2)
Without data, all you are is another person with an opinion. Show learners the power of statistics and probability in making conclusions and predictions. Using two-way frequency tables, learners determine independence by analyzing...
EngageNY
The Graph of a Linear Equation in Two Variables Is a Line
Show your class that linear equations produce graphs of lines. The 20th segment in a unit of 33 provides proof that the graph of a two-variable linear equation is a line. Scholars graph linear equations using two points, either from...
Curated OER
Investigation - Mathematical Reasoning: Tables and Chairs
Fourth graders draw pictures and diagrams as they attempt to solve a mathematical problem involving the arrangement of eleven tables shaped like equilateral triangles and the seating of exactly twenty-five people.
Virginia Department of Education
Inductive and Deductive Reasoning
Introduce pupils to the two types of reasoning, inductive and deductive. Classmates work in pairs or small groups to learn the difference between the two and apply these reasonings to develop valid conclusions.
EngageNY
Using Sample Data to Compare the Means of Two or More Populations
Determine whether there is a difference between two grades. Teams generate random samples of two grade levels of individuals. Groups use the mean absolute deviation to determine whether there is a meaningful difference between the...
EngageNY
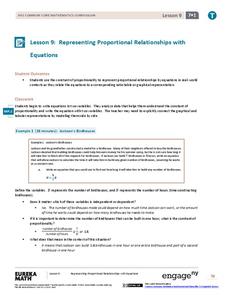
Representing Proportional Relationships with Equations 2
Scholars determine how long it takes to build a birdhouse with the second activity on using equations with proportional relationships. The resource uses examples such as birdhouse building and produce prices to encourage pupils to write...
EngageNY
Identifying Proportional and Non-Proportional Relationships in Graphs 2
Work together to find proportional relationships. The sixth portion of the 22-part unit is a collaborative exercise. Teams work with given representations of relationships and determine if they are proportional by creating tables and...
EngageNY
An Exercise in Changing Scales 2
Reflect on altering scale factors. The last instructional activity in the series of 22 has the class compare the two scale drawings they created. They realize that the scale drawing becomes a scale drawing of each other. Class members...
Illustrative Mathematics
Walk-a-thon 1
Your mathematician's job is to explore the relationship between hours and miles walked during a walk-a-thon. The activity compels your learners to experiment with different means in finding out this proportional relationship. The answer...


