Curated OER
From F to F
In this derivatives worksheet, students solve 16 short answer problems. Students use a graph of a derivative to determine local maximums and minimums, concavity, inflection points, etc.
Curated OER
Linear Programming
In this algebra worksheet, students calculate the maximum and minimum of a shaded region. They identify the boundaries and their vertices's. There are 2 problems.
Curated OER
Graphical Analysis
Get out your TI-nspire graphing calculator and explore polynomials. Learners determine where a given polynomial are increasing or decreasing, find maximums, minimums, and zeros of polynomials, and discuss end behavior of polynomials....
Teach Engineering
Earthquakes Living Lab: Locating Earthquakes
There are patterns in nearly everything — even earthquakes. Pairs research current earthquakes to see if there are any patterns. They determine the mean, median, and mode of the earthquake data, along with the maximum and minimum. Using...
Curated OER
Galileo's Battle for the Heavens
Students examine the nature of sunspot cycles and define solar minimums and maximums. In this sunspot lesson students construct and evaluate graphs of the current sunspot cycle.
Curated OER
Mathematics of Image Processing
In this mathematics of image processing instructional activity, students solve 10 various types of problems related to image processing on a computer. They type in all the commands listed and figure out what is going on. Then, students...
Curated OER
Calculus Worksheet: Graphs of Functions (2)
Students are given a trigonometric function. They find the period of f, the maximum and ninimum values of f(x). Students compute the smallest positive value of x and the smallest positive value of x. They sketch the graph of the function.
Curated OER
Stretching the Quads
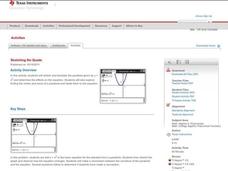
Scholars investigate transforming parabolas. In this transforming parabolas lesson, they take the parent graph y=x^2 and transform it by shifting left, right, up, and down and shrinking and stretching. The class finds maximums,...
Curated OER
The "U's" Have IT!
Students explore the maximum and minimum values of parabola. In this exponential equations lesson, students use graphing calculators or TI Interactive Software to calculate values of parabola and graph x-intercepts of parabola.
Mathed Up!
Completing the Square
Learners review how to use the completing-the-square method to identify maximum and minimum values of a quadratic function by watching a video. They see how the vertex form relates to the extreme values of a quadratic function, and use...
Balanced Assessment
Triangle in Circle
Even kindergartners can draw triangles in circles, but the assessment task requires a bit more geometric knowledge. Scholars investigate triangles that have a diameter of a circle as one of its sides. They must consider triangles that...
Curated OER
MATH 155 - Worksheet 11. Limits
In this limits instructional activity, students find the limits of given equations. They find the absolute maximum and absolute minimum values of a function. This two-page instructional activity contains four problems.
Curated OER
Systems of Linear Inequalities #5
In this systems of linear inequalities worksheet, students solve 10 multiple choice problems about linear inequalities. Students determine the maximum and minimum values of systems of linear inequalities.
Curated OER
Algebra 2 - Linear Programming
Students read real world problems, determine the variables, and set up the function using algebraic statements. After entering data into the graphing calculator, they display information in the form of graphs and scatter plots. ...
Curated OER
Froot Loops to the Max - Nutrition Worksheet
In this nutrition worksheet, students solve 10 various problems related to reading the nutritional panel on the side of a box of Froot Loops. They determine how many cups are needed to achieve a certain amount of calories. Then, students...
Curated OER
Froot Loop to the Max - Ordered pairs
In this Froot Loop to the Max worksheet, students complete 21 different sets of ordered pairs. They plot each of the ordered pairs listed on the sheet, connecting them in order from #1 through #21. Then, students determine whether it is...
Curated OER
Three Methods for Using Quadratic Functions to Model Data
In this modeling data worksheet, students use quadratic functions to model data using three different methods. This worksheet provides explanations and an example. Additionally, students are given the steps to find the maximum or...
Curated OER
Solving Quadratic Equations by Graphing
In this quadratic equation worksheet, learners solve quadratic equations by graphing on a coordinate plane. Given the roots and maximum or minimum points, students graph a quadratic equation. This one-page worksheet contains five problems.
Flipped Math
Unit 10 Review: Quadratics
Everything one wanted to know about parabolas in one place. Pupils work 27 problems as a review of the unit on quadratics. Problems range from determining key features of the function and using that information to graph the parabola, to...
Curated OER
Representing Data 2: Using Box Plots
What information can be gleaned from a box and whiskers plot? Discuss the five summary values - minimum, maximum, upper and lower quartiles, and median - and what conclusions can be made from these values? Included here is a matching...
Illustrative Mathematics
The Florist Shop
A real-world approach to common multiples asks learners to find different groups of flowers based on their multiples. Useable as a class activity or independent exercise, they will have to organize their thoughts to explain the totals of...
Willow Tree
Line Plots
You can't see patterns in a jumble of numbers ... so organize them! Learners take a set of data and use a line plot to organize the numbers. From the line plot, they find minimum, maximum, mean, and make other conclusions about the data.
Illustrative Mathematics
Hours of Daylight 1
The midline of the mathematical model of the number of hours of sunlight is not 12 hours. Pupils use the modeling cycle to determine a function that will model the number of hours of sunlight at a location of their choosing. Using...
Flipped Math
Calculus AB/BC - Using the First Derivative Test to Determine Relative Local Extrema
Critically apply intervals of increasing and decreasing. Pupils watch a video to see how finding a critical point and finding intervals of increasing and decreasing work together to identify local extrema. Scholars use the first...
Other popular searches
- Maximum Minimum
- Maximum Minimum Parabolas
- Maximum Minimum Mode
- Maximum Minimum Extrema
- Global Maximum or Minimum
- Free Lessons Maximum Minimum
- Maximum Minimum Mode Range
- Maximum Minimum Sets Venn
- Maximum Minimum Graph
- Maximum Minimum Extremism
- Venn Diagram Maximum Minimum
- Maximum Minimum Extremum


