Statistics Education Web
What Does the Normal Distribution Sound Like?
Groups collect data describing the number of times a bag of microwave popcorn pops at given intervals. Participants discover that the data fits a normal curve and answer questions based on the distribution of this data.
Virginia Department of Education
Normal Distributions
Pupils work to find probabilities by using areas under the normal curve. Groups work to calculate z-scores and solve real-world problems using the empirical rule or tables.
EngageNY
Normal Distributions (part 2)
From z-scores to probability. Learners put together the concepts from the previous lessons to determine the probability of a given range of outcomes. They make predictions and interpret them in the context of the problem.
Virginia Department of Education
Organizing Topic: Data Analysis
Learners engage in six activities to lead them through the process of conducting a thorough analysis of data. Pupils work with calculating standard deviations and z-scores, finding the area under a normal curve, and sampling...
Statistics Education Web
Using Dice to Introduce Sampling Distributions
Investigate the meaning of a sample proportion using this hands-on activity. Scholars collect data and realize that the larger the sample size the more closely the data resembles a normal distribution. They compare the sample proportion...
Curated OER
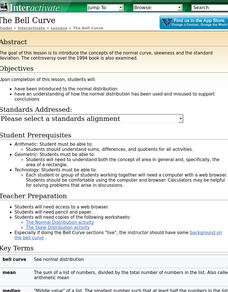
The Bell Curve
Learners are introduced to the concepts of the normal curve, skewness and the standard deviation. They discuss how the normal distribution has been used and misused to support conclusions.
Curated OER
The Normal Distribution
Students investigate normal distribution. In this statistical analysis lesson students investigate the variety of circumstances in which the normal distribution can be used. Students apply the normal distribution to solve...
Statistics Education Web
Who Sends the Most Text Messages?
The way you use statistics can tell different stories about the same set of data. Here, learners use sets of data to determine which person sends the most text messages. They use random sampling to collect their data and calculate a...
Curated OER
The Bell Curve
Students are introduced to the normal distribution and examine the bell curve controversy.
Statistics Education Web
Now You SeeIt, Now You Don't: Using SeeIt to Compare Stacked Dotplots to Boxplots
How does your data stack up? A hands-on activity asks pupils to collect a set of data by measuring their right-hand reach. Your classes then analyze their data using a free online software program and make conclusions as to the...
Curated OER
The Bell Curve
Learners explore the concept of the bell curve. In this bell curve lesson, students discuss the controversy associated with the bell curve. Learners use an applet to explore a normal distribution. Students discuss mean, median, mode,...
Curated OER
Looking Normal
Young scholars identify the shape of a function. In this statistics lesson, students plot the data collected. They analyze their data for positive, negative or no correlation. They find the line of best fit.
National Endowment for the Humanities
On This Day With Lewis and Clark
Walk in the footsteps of Lewis and Clark as they discover the wonders, beauty, and dangers of the American frontier. After gaining background knowledge about Thomas Jefferson and the Louisiana Purchase, young explorers use primary...
Statistics Education Web
Walk the Line
How confident are you? Explore the meaning of a confidence interval using class collected data. Learners analyze data and follow the steps to determine a 95 percent confidence interval. They then interpret the meaning of the confidence...
Institute for Humane Education
Where Are the People like Me?
Are some characteristics more desired than others?Scholars examine attributes of characters in books, models in catalogs, and articles in magazines. Discussion leads to identifying characteristics they see more often as well as...
Curated OER
Application and Modeling of Standard Deviation
The first activity in this resource has learners computing the mean and standard deviation of two different data sets and drawing conclusions based on their results. The second activity has them using a dice-rolling simulation to...
Curated OER
Electric Power Transmission and Distribution
Students explain how power is transmitted over long distances. In this physics lesson, students simulate controlling power flow in parallel transmission lines. They discuss several applications of wireless power transmission.
Deliberating in a Democracy
Freedom of Expression
Should democracies include hate speech as a protected right? Scholars analyze the rights found under the First Amendment to the Constitution through researching evidence. Freedom of expression becomes the focal point of the...
Workforce Solutions
Social Media Pit Stop
Think before you post! Employers are watching! That's the takeaway from an activity that asks learners to rate their social media posts using a scale developed by recruiters. The activity ends with scholars brainstorming ways to improve...
Curated OER
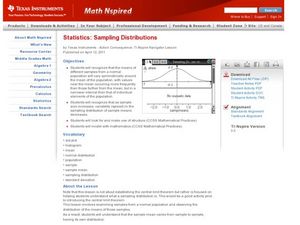
Sampling Distributions
Students analyze sampling from different population. In this statistics lesson, students define the meaning of sample sizes and what causes an increase or decrease. They graph their data on the Ti calculator and draw conclusion from the...
Curated OER
Assessing Normalcy
Learners define normal distribution as it relates to the bell curve. In this statistics lesson, students use the central tendencies of mean, median and mode to solve problems. They plot their data and draw conclusion from the graphs.
Curated OER
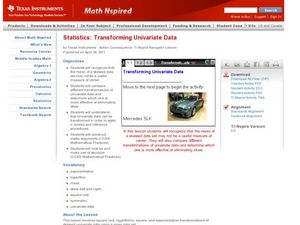
Transforming Univariate Data
Learners analyze plotted data in this statistics lesson. They differentiate between skewed and normal data. They also explore and interconnect exponential growth and decay as it relates to the data.
Curated OER
Using Blood-Typing to Determine Causes of Death in Surgery Patients
For this simulation activity, young biologists examine blood types to determine whether the death rate in a hospital was caused because of incorrect identification of patient blood types. You will need obtain and follow the procedures of...
Curated OER
Area And Perimeter Using Pentominoes
Third graders engage in an enrichment lesson exploring the concepts of area and perimeter. They construct new pentominoes that are 3 times the size of normal ones and then identify the area and perimeter measurements. They then create a...


