Statistics Education Web
It’s Elemental! Sampling from the Periodic Table
How random is random? Demonstrate the different random sampling methods using a hands-on activity. Pupils use various sampling techniques to choose a random sample of elements from the periodic table. They use the different samples to...
Education Closet
Equal Rhythms
Engage young mathematicians in learning about fractions with this cross-curricular math and music lesson plan. After listening to and repeating different beat patterns, children realize that musical notes are just another way of...
Fun Music Company
The Bass Clef
Every Good Boy, and girl for that matter, will do just fine with this activity as they are asked to correctly trace and then draw bass clefs on the provided learning exercise.
Sunday School Resources
Noah & the Ark
Support your study of Noah's Ark with these materials. Included here are word puzzles, coloring pages, math exercises, and more, all related to Noah's Ark.
1 plus 1 plus 1 equals 1
I Can Read! Sight Words Set #9
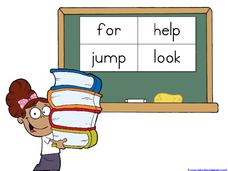
Work on sight words with a series of fun reading activities. Kids connect the dots, match words, and play bingo while studying the words for, jump, help, and look.
1 plus 1 plus 1 equals 1
I Can Read! Sight Words Set #1
Focus on the fundamentals of reading with a series of sight word activities. Kids work with the words a, and, see, and the by connecting the dots, playing bingo, and finding the words in a mixed-up list.
1 plus 1 plus 1 equals 1
I Can Read! Sight Words Set #3
Practice sight words with an array of fun activities. Kids focus on like, is, my, and it with bingo games, connecting the dots, and tracing activities.
101 Questions
The Mystery Line
Take the mystery out of linear functions. Provided an image with no scale, learners guess where the line that connects them might cross the y-axis. After providing the coordinates of the points, they realize scale is an important...
American Museum of Natural History
In Pictures: Flamingo
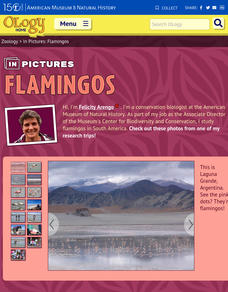
Fifteen photos take scholars on a journey to Laguna Grande, Argentina to observe how a group of scientists work with native flamingos. Stunning images showoff the flamingo, its environment, scientists in the wild, and the impact the...
Curated OER
Paper Spider
Young artists don't have to wait for Halloween to craft eensy-weensy spiders. A one-page template includes directions and a pattern for the spider's body and legs. These little arachnids, hanging from the ceiling or the wall...
This Reading Mama
Compound Word Pack
Class + room = classroom! And your class + this compound word game = fun and learning! Kids match cards that include words and sometimes images to create compound words.
Reading Resource
/o/ Word List
Caught, off, robin. The /o/ sound if the focus of an activity that asks readers to identify and highlight the /a/ sound in a list of words. The exercise is designed to develop the awareness skills needed to detect the vowel sounds in...
Mathematics Assessment Project
Candle Box
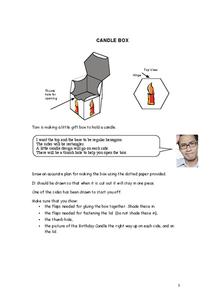
Individuals draw a net for a hexagonal pyramid — with some stipulations. The net must contain the printed images so they appear correctly on the box, along with tabs to glue the box together.
Statistics Education Web
The United States of Obesity
Mississippi has both the highest obesity and poverty rate in the US. Does the rest of the data show a correlation between the poverty and obesity rate in a state? Learners tackle this question as they practice their skills of regression....
Statistics Education Web
Are Female Hurricanes Deadlier than Male Hurricanes?
The battle of the sexes? Scholars first examine data on hurricane-related deaths and create graphical displays. They then use the data and displays to consider whether hurricanes with female names result in more deaths than hurricanes...
Statistics Education Web
Text Messaging is Time Consuming! What Gives?
The more you text, the less you study. Have classes test this hypothesis or another question related to text messages. Using real data, learners use technology to create a scatter plot and calculate a regression line. They create a dot...
Radford University
Danger! – An Analysis of the Death Toll of Natural Disasters
Decipher the danger of natural disasters. Using researched data, scholars work in groups to create data displays on the number of deaths from different types of natural disasters. They share their graphical representations with the class...
Radford University
Is Fall Normal?
Fine the normality of fall measurements. Pairs collect measurements of fall leaves and one other fall object. Using the measurements, the groups determine the descriptive statistics for the object and using the Empirical Rule, figure out...
Curriculum Corner
Ice Cream Booklet
On the days leading up to summer, use a booklet of practice skill sheets in the classroom. Beginner pupils should be able to master the skills they've learned in math and reading before they head home for the summer, like counting to 30,...
Radford University
What is My Standing Height Wise?
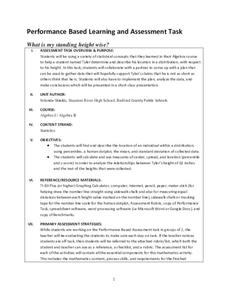
Given a scenario in which a class member wants to prove his height is not an outlier, pairs devise a plan and gather evidence to help support his claim. The small groups implement their plans and create graphical displays of their data...
Virginia Department of Education
Modeling the Big Bang Theory
Young astronomers learn about the Big Bang Theory and redshift through a hands-on activity in the last installment of a three-part series. Participants draw dots on balloons and then inflate them to model how galaxies moved farther apart...
Teach Engineering
Machines and Tools (Part 2)
Which pulley system will give us a whale of a good time? Teams compare the theoretical and actual mechanical advantages of different pulley systems. They then form a recommendation for how to move a whale from an aquarium back to the ocean.
EngageNY
The Mean Absolute Deviation (MAD)
Is there a way to measure variability? The ninth resource in a series of 22 introduces mean absolute deviation, a measure of variability. Pupils learn how to determine the measure based upon its name, then they use the mean...
Statistics Education Web
Walk the Line
How confident are you? Explore the meaning of a confidence interval using class collected data. Learners analyze data and follow the steps to determine a 95 percent confidence interval. They then interpret the meaning of the confidence...


