Scholastic
Study Jams! Double-Line Graphs
With two summers of babysitting money, Mia needs a way to compare her earning from both years. Show your learners that they can organize the data onto a double-line graph to easily compare which summer was more profitable. The lesson...
Scholastic
Study Jams! Choosing the Correct Graph
With so many types of graphs, don't let your learners get stuck figuring out which one to use. To track how Zoe spent her allowance, use this interactive lesson to review all the types of graphs and pick the best one to display the data....
CK-12 Foundation
And and Or Statements: Number Lines
Compound statements are actually quite simple. A virtual interactive provides a means to graph solution sets to compound statements involving and and or. Users then answer a few challenge questions on these solution sets.
Physics Classroom
Using Graphs
Many university professors complain incoming scholars struggle with interpreting graphs. A skill builder offers three different types of exercises including calculating slope, interpreting graphs, and extrapolating outside the plotted...
CK-12 Foundation
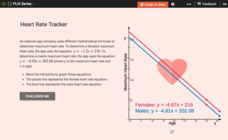
Graphs of Linear Systems: Heart Rate Tracker
Max out heart rates for males and females. Formulas of maximum heart rates provide the equations for a linear system. Pupils use the interactive to graph the equations for males and females and determine their points of intersection. The...
Scholastic
Study Jams! Line Plots
Data analysts are guided through the arrangement of whole-number data onto a line plot by listening and viewing a high-quality, animated, and narrated set of slides.
CK-12 Foundation
Graphs for Discrete and for Continuous Data: Discrete vs. Continuous Data
Not all data is the same. Using the interactive, pupils compare data represented in two different ways. The learners develop an understanding of the difference between discrete and continuous data and the different ways to represent each...
CK-12 Foundation
Existence: One-to-One Functions and Inverses
One-to-one means the answer is simple, right? Given four graphs, pupils use a vertical line to test each graph to find out if they are one-to-one. By using the resource, learners realize that not all one-to-one relations are functions....
Curated OER
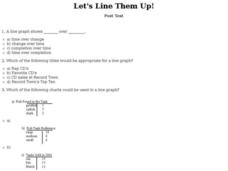
Let's Line Them Up! Post Test
In this line graphs activity, students answer multiple choice questions about line graphs. Students complete 10 multiple choice questions.
Shodor Education Foundation
Vertical Line Test
Connect the points to create a function. Using points given by the applet, pupils try to connect them to create a line that would pass the vertical line test. The resource keeps track of the number of sets the learner is able to identify...
CK-12 Foundation
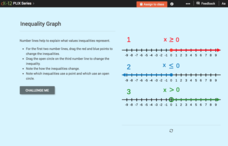
Inequality Expressions: Inequality Graph
Don't let inequalities be a drag. As young mathematicians drag the endpoint of the graph of an inequality in an interactive, the algebraic form of the inequality changes. This helps them see how the graph connects to the inequality.
GeoGebra
All For One, One For All
Will someone please constrain those pets? Pupils create two constraint equations on the number of cats and dogs for a pet sitter. They choose specific points and determine whether the point satisfies one or both constraints. The...
PHET
Graphing Slope-Intercept
Slope-intercept form ... perhaps it has something to do with slope and intercepts? An easy-to-use interactive lets users adjust the locations of two points on a line. The interactive automatically updates the slope-intercept form of the...
PHET
Graphing Lines
Ready to increase pupils' understanding of slope with an upward slope? Scholars use an interactive that allows users to move two points on a coordinate plane. The interactive then automatically calculates the slope, the slope-intercept...
CK-12 Foundation
Determining the Equation of a Line: Temperature Conversion Challenge
Line up the temperature conversions. Pupils create the linear function between Celsius and Fahrenheit on a graph by plotting the freezing and boiling points of water. The scholars determine how the relationship changes based upon...
Curated OER
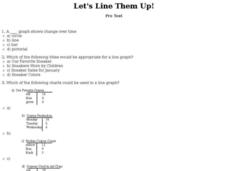
Let's Line Them Up!
In this line graph worksheet, students read through the problems about graphing and line graphs. Students select the best answer to solve the 10 online questions.
CK-12 Foundation
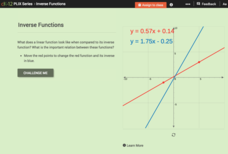
Inverse Functions
Provide a graphical view of inverses. Pupils manipulate points on a line and see the relationship of the graph with the graph of its inverse. Using the relationship between the graphs, scholars respond to questions concerning inverses...
Khan Academy
Challenge: Lined Paper
Now create your own graph paper with this JavaScript programming activity! First, change the while loop that draws horizontal lines into a for loop. Then, add another for loop that draws the vertical lines. For an added challenge,...
CK-12 Foundation
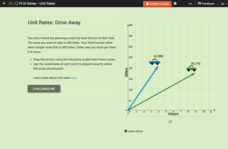
Comparison of Unit Rates: Drive Away
Five questions make up an interactive that challenges mathematicians to compare unit rates. Word problems question scholars about two friends going on a road trip. Scholars manipulate two cars on a coordinate plane to help solve word...
CK-12 Foundation
Understand and Create Histograms: Car Sales
Create a history of car sales. Pupils create a histogram/bar graph to show the number of car sales made during the week. Using the data display, learners calculate numerical summaries of the data and find the percent of cars sold during...
Curated OER
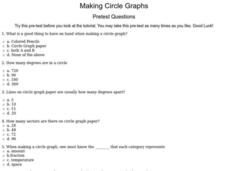
Making Circle Graphs
In this circle graphing worksheet, 6th graders answer ten multiple choice questions based on their knowledge of circle graphs. This is an interactive worksheet.
Curated OER
Using Data to Make Graphs: Pretest
In this data worksheet, 5th graders answer multiple choice questions on data and graphs. Students answer 10 multiple choice questions.
Shodor Education Foundation
Multiple Linear Regression
You'll have no regrets when you use the perfect lesson to teach regression! An interactive resource has individuals manipulate the slope and y-intercept of a line to match a set of data. Learners practice data sets with both positive and...
Curated OER
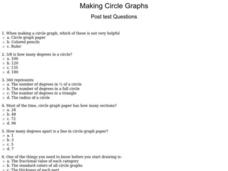
Making Circle Graphs
In this circle graphs worksheet, students answer multiple choice questions about how to make circle graphs. Students answer 10 questions total.


