Statistics Education Web
Sampling in Archaeology
Compare different random sampling types using an archaeological setting. Scholars collect data from an archaeological plot using simple random samples, stratified random samples, systematic random samples, and cluster random samples....
Statistics Education Web
Using Dice to Introduce Sampling Distributions
Investigate the meaning of a sample proportion using this hands-on activity. Scholars collect data and realize that the larger the sample size the more closely the data resembles a normal distribution. They compare the sample proportion...
Statistics Education Web
I Always Feel Like Somebody's Watching Me
Future statisticians and potential psychics first conduct an experiment to collect data on whether a person can tell if someone is staring at them. Statistical methods, such as hypothesis testing, chi-square tests, binomial tests, and...
Curated OER
Vernier - A Speedy Slide with EasyData™ App and CBR 2™
Mathematicians use a CBR 2™ motion detector to determine their speed or velocity going down a playground slide. They also experiment with different ways to increase their speed going down the slide. Finally, students complete the Student...
Curated OER
Color Burst
Fourth graders explore how colors react in water (chromatography) and other solvents. They observe, investigate, measure, record data and communicate their results in the form of graphs/charts and narration presented to the class....
Curated OER
Foliage Tracker
Young scholars discuss the change of leaf colors and the role that climate and elevation play in those changes. They then track leaf changes, input data, and graph foliage changes with a free online tool.
PBS
Investigating Seasonal Temperature and Precipitation Variations
Weather seems unpredictable, but is it really? Learners collect weather data from online interactives and build data displays. They use their displays to identify temperature and precipitation patterns in different areas.
Curated OER
Graphing Lesson Plans
By using hands-on graphing lesson plans students can learn how to collect data, and display the information using graphs.
Curated OER
Observing the Evidence
Fifth graders explore how to do research from a large group. They explore how to choose a representative sample and collect data from it.
Curated OER
Among the Hidden - Population Math Activity
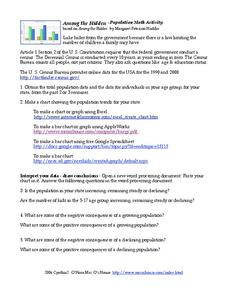
In this population worksheet, students collect data on population by researching the Census Bureau and then make online graphs and answer short answer questions about the data. Students complete 5 problems total.
Curated OER
Data Analysis of Ground Level Ozone
Sixth graders construct and interpret graphs from ozone data collected in Phoenix area. Can be adapted to other areas.
BioEd Online
Butterflies in Space
How does gravity affect the life cycle of a butterfly? Learn first-hand what types of investigations astronauts perform in space by following along with one of NASA's experiments. Create butterfly habitats in the classroom with specific...
Curated OER
Gathering Statistics for Research
Students gather statistics to include in their research. In this statistics activity, students investigate how to incorporate statistics into research and other readings besides math. They collect data based on other topics, analyze the...
Curated OER
Virtual College Scavenger Hunt
It's always great to take learners to a real college campus for a visit. However, that's not always possible given time and money constraints. Take them on a virtual tour instead. Pupils discuss the four types of colleges they will...
Magic of Physics
Unit Converter I
Talk about a cool tool! Convert between units with the click of a mouse using a handy online resource. Enter the starting measurement and units for quantities such as torque, speed, and inertia, then sit back and relax while the computer...
American Museum of Natural History
Be an Energy Saver
Small conservation steps can have large impacts. Individuals access an online checklist and rate themselves on their conservation practices. They reflect on current practices and learn about new ways to contribute and how to do better....
Curated OER
Beginning Graphs in MS Excel
Students practice creating graphs in Microsoft Excel. In this technology lesson, students conduct a random survey and collect data. Students use the Microsoft Excel program to create a bar graph of the data.
The New York Times
Crossing the Line Online: Sexual Harassment and Violence in the Age of Social Media - NYTimes.com
Sexual harassment and sexual violence are by no means new issues. What has changed is the role of social media in these issues. This powerful and troubling lesson uses a specific rape case to launch research into a discussion of the...
Curated OER
Graphs and Spreadsheets
Students collect data and present it in a graph and/or a spreadsheet, depending on their previous understanding of technology.
Curated OER
How Do Earthquakes Affect Buildings?
Students simulate earthquakes utilizing an online program, and examine the earthquake-proofing construction for their building. They chart and analyze their simulated data using
Curated OER
Interpreting Line Graphs
Fifth graders interpret line graphs. In this graphing instructional activity, 5th graders first begin by reviewing the difference in bar and line graphs and what they are used for. Students practice interpreting the data on various line...
American Statistical Association
More Confidence in Salaries in Petroleum Engineering
Making inferences isn't an exact science. Using data about salaries, learners investigate the accuracy of their inferences. Their analyses includes simulations and randomization tests as well as population means.
American Statistical Association
Scatter It! (Using Census Results to Help Predict Melissa’s Height)
Pupils use the provided census data to guess the future height of a child. They organize and plot the data, solve for the line of best fit, and determine the likely height and range for a specific age.
Facebook
Metadata
In previous lessons, young journalists learned about how to trace the original source of scrapes and memes. This interactive lesson plan teaches them another important step in the verification process. Participants learn how to analyze...


