Charleston School District
Graphing Functions
How do letters and numbers create a picture? Scholars learn to create input/output tables to graph functions. They graph both linear and nonlinear functions by creating tables and plotting points.
Curated OER
Algebra 2 Desmos Graphing Project
Encourage class members to get creative with functions. Pairs write their names and draw pictures using a graphing application with a collaborative graphic project. The resource provides the requirements for the project, as well as a...
Houghton Mifflin Harcourt
Nature Walk: English Language Development Lessons (Theme 2)
Walking in nature is the theme of a unit designed to support English language development lessons. Scholars look, write, speak, and move to explore topics such as camping, woodland animals, instruments,...
Willow Tree
Histograms and Venn Diagrams
There are many different options for graphing data, which can be overwhelming even for experienced mathematcians. This time, the focus is on histograms and Venn diagrams that highlight the frequency of a range of data and overlap of...
Point Pleasant Beach School District
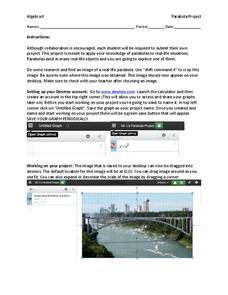
Parabola Project
Class members select a picture that contains a parabola and construct a drawing of it using function graphs in the quadratic project. Individuals restrict the domains of the functions to create a more accurate drawing. They then submit a...
ProCon
Gold Standard
If all the mined gold in the world was melted across a football field, it would rise 5.4 feet. That's just one interesting fact pupils learn when using the debate topics website to determine if the United States should return to a gold...
Charleston School District
3D Applications of the Pythagorean Theorem
How many right triangles can you find in a prism, cone, or pyramid? Using right triangles to find lengths in three-dimensional figures is the focus of the lesson. After working with the Pythagorean Theorem to find missing side...
Charleston School District
Analyzing Scatter Plots
Scatter plots tell a story about the data — you just need to be able to read it! Building from the previous lesson in the series where learners created scatter plots, they now learn how to find associations in those scatter plots....
Geophysical Institute
Latitude and Longitude with Google Earth
Travel the world from the comfort of your classroom with a lesson that features Google Earth. High schoolers follow a series of steps to locate places all over the earth with sets of coordinates. Additionally, they measure the distance...
Khan Academy
Khan Academy: Picture Graphs (Pictographs) Review
Picture graphs are a fun way to display data. This article reviews how to create and read picture graphs (also called pictographs).
University of Saskatchewan (Canada)
University of Saskatchewan: Graphing Polynomials
An introduction to the graphs of polynomial functions by looking at the roots of the polynomials, or where it crosses the x-axis. Includes links to pictures of graphs and detailed explanations.
Windstream
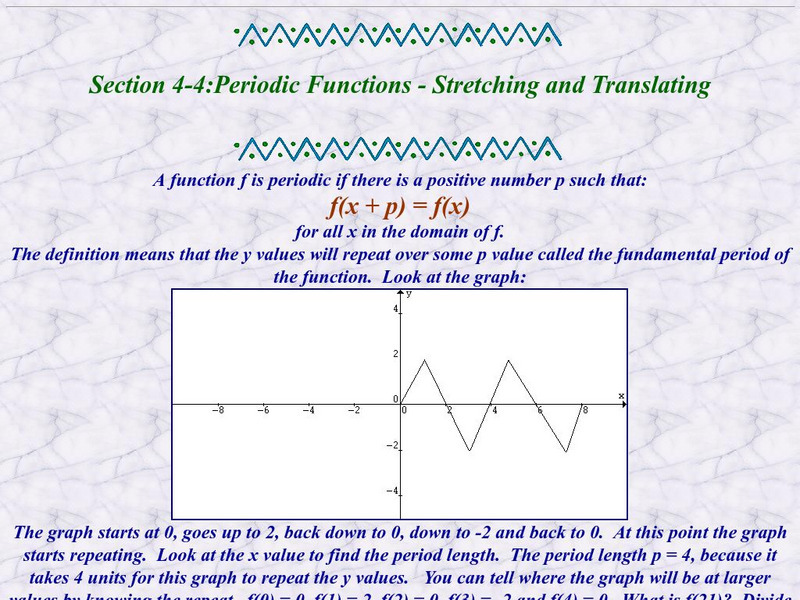
Ojk's Precalculus Study Page: Periodic Functions, Stretching and Translating
This online tutorial offers a comprehensive introduction to translating and stretching graphs, and what this implies about the function. Includes lots of pictures and examples.
University of Illinois
University of Illinois Urbana Champaign: Forces and Winds
What causes wind? How does wind affect our weather? This website is neatly organized into topics about pressure, gradient force, Coriolis force, geostrophic wind, gradient wind, friction, boundary layer wind, and sea and land breezes....
Simon Fraser University
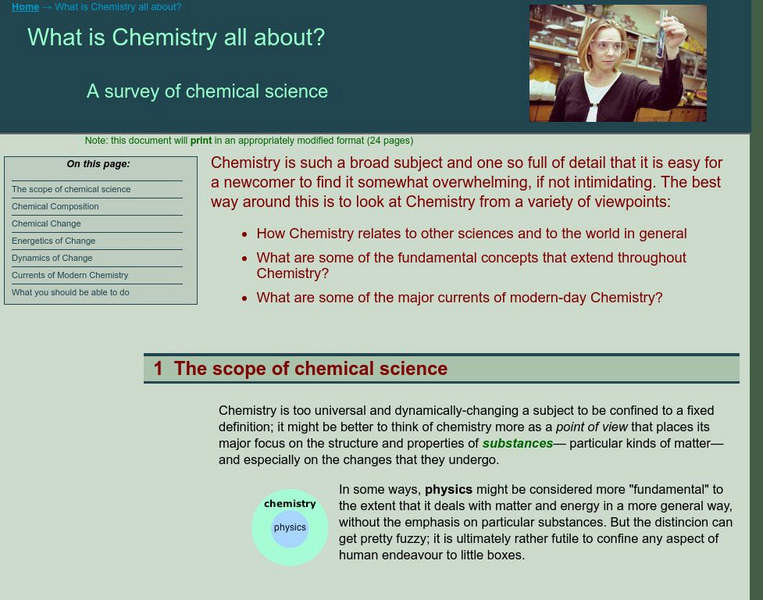
Chem1 Virtual Textbook: What Is Chemistry All About?
Covering a range of eight topics related to chemistry, this resource provides a wealth of information complete with pictures, charts, graphs, and examples. Includes information on elements, compounds, atoms, molecules, structures,...
University of Pennsylvania
University of Pennsylvania: Solid State Chemistry: Describing Crystalline Solids
This site contains in-depth information on crystalline solids. Includes basic concepts, pictures, learning graphs, and useful tools.
Wolfram Research
Wolfram Math World: Inverse Hyperbolic Functions
This site defines the six fundamental hyperbolic fucntions and contains related links. Also provides graphs and pictures for further understanding.
Other
Chemical Elements: Iodine
This site from Chemical Elements.com has great information on iodine. It lists the basic information and then provides the atomic structure in the form of a graph picture. A list of isotopes is also provided.
Wolfram Research
Wolfram Math World: Scalar Multiplication
Describes how a scalar can be multiplied to a vector and shows this using diagrams. Site also contains related links, graphs, and pictures.
Other popular searches
- Coordinate Picture Graphs
- Christmas Picture Graphs
- M&m Picture Graphs
- Hidden Picture Math Graphs
- Picture Graphs Worksheets
- Math Lessons Picture Graphs
- 5th Grade Picture Graphs
- Bar and Picture Graphs
- Thanksgiving Picture Graphs
- Circle and Picture Graphs
- Picture Graphs Template
- Reading Picture Graphs


