EngageNY
Modeling Relationships with a Line
What linear equation will fit this data, and how close is it? Through discussion and partner work, young mathematicians learn the procedure to determine a regression line in order to make predictions from the data.
EngageNY
Interpreting Residuals from a Line
What does an animal's gestation period have to do with its longevity? Use residuals to determine the prediction errors based upon a least-square regression line. This second lesson on residuals shows how to use residuals to create a...
EngageNY
Comparing Estimated Probabilities to Probabilities Predicted by a Model
Small groups devise a plan to find the bag that contains the larger percentage of blue chips. they then institute their plans and compare results to the actual quantities in the bags.
Illustrative Mathematics
Tossing Cylinders
Everyone loves a lesson that involves throwing things around! To understand probability, your experimenters will predict how different cylinder-shaped objects will land when tossed. When the data is collected, they will calculate the...
Noyce Foundation
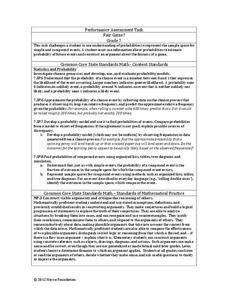
Fair Game?
The game should be fair at all costs. The mini-assessment revolves around the ability to use probabilities to determine whether a game is fair. Individuals determine compound events to calculate simple probabilities and make...
EngageNY
Modeling a Context from Data (part 2)
Forgive me, I regress. Building upon previous modeling activities, the class examines models using the regression function on a graphing calculator. They use the modeling process to interpret the context and to make predictions...
Illustrative Mathematics
Election Poll, Variation 1
Your class will learn what it means to take a random sample of a population and to draw inferences from the information gained. In part a, of the exercise, you discuss with your class how students during a class election can be best...
EngageNY
Modeling from a Sequence
Building upon previous knowledge of sequences, collaborative pairs analyze sequences to determine the type and to make predictions of future terms. The exercises build through arithmetic and geometric sequences before introducing...
Illustrative Mathematics
Heads or Tails
Heads! A great way to practice probability is to flip a coin in class. The provided data allows your mathematicians to predict the probability of heads in ten coin flips. Bring coins to class and allow your own trial of heads or tails....
Illustrative Mathematics
Chocolate Bar Sales
In this real-world example, algebra learners start to get a sense of how to represent the relationship between two variables in different ways. They start by looking at a partial table of values that define a linear relationship. They...
EngageNY
Analyzing Residuals (Part 2)
Learn about patterns in residual plots with an informative math lesson. Two examples make connections between the appearance of a residual plot and whether a linear model is the best model apparent. The problem set and exit ticket...
EngageNY
Writing and Evaluating Expressions—Exponents
Bring your young mathematicians into the fold. Scholars conduct an activity folding paper to see the relationship between the number of folds and the number of resulting layers in the 23rd installment of a 36-part module. The results of...
EngageNY
More on Modeling Relationships with a Line
How do you create a residual plot? Work as a class and in small groups through the activity in order to learn how to build a residual plot. The activity builds upon previous learning on calculating residuals and serves as a...
EngageNY
The Slope of a Non-Vertical Line
This lesson plan introduces the idea of slope and defines it as a numerical measurement of the steepness of a line. Pupils then use the definition to compare lines, find positive and negative slopes, and notice their definition holds for...
EngageNY
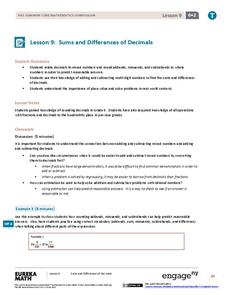
Sums and Differences of Decimals
Sometimes dealing with decimals is so much easier than dealing with fractions. The ninth lesson plan in a 21-part module has the class consider situations when it might be easier to add or subtract fractions by first converting to...
EngageNY
Analyzing Residuals (Part 1)
Just how far off is the least squares line? Using a graphing calculator, individuals or pairs create residual plots in order to determine how well a best fit line models data. Three examples walk through the calculator procedure of...
Noyce Foundation
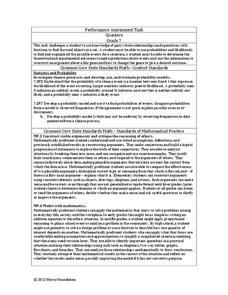
Counters
For some, probability is a losing proposition. The assessment item requires an understanding of fraction operations, probability, and fair games. Pupils determine the fractional portions of an event. They continue to determine whether...
EngageNY
The Graph of a Linear Equation in Two Variables
Add more points on the graph ... and it still remains a line! The 13th installment in a series of 33 leads the class to the understanding that the graph of linear equation is a line. Pupils find several solutions to a two-variable linear...
EngageNY
From Ratio Tables, Equations and Double Number Line Diagrams to Plots on the Coordinate Plane
Represent ratios using a variety of methods. Classmates combine the representations of ratios previously learned with the coordinate plane. Using ratio tables, equations, double number lines, and ordered pairs to represent...
EngageNY
Modeling a Context from Data (part 1)
While creating models from data, pupils make decisions about precision. Exercises are provided that require linear, quadratic, or exponential models based upon the desired precision.
EngageNY
Matrix Notation Encompasses New Transformations!
Class members make a real connection to matrices in the 25th part of a series of 32 by looking at the identity matrix and making the connection to the multiplicative identity in the real numbers. Pupils explore different...
EngageNY
Tax, Commissions, Fees, and Other Real-World Percent Problems
Pupils work several real-world problems that use percents in the 11th portion of a 20-part series. The problems contain percents involved with taxes, commissions, discounts, tips, fees, and interest. Scholars use the equations formed for...
EngageNY
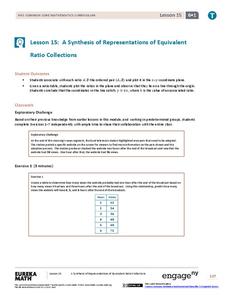
A Synthesis of Representations of Equivalent Ratio Collections
Make all the ratio representations fit together. The 15th segment in a series of 29 presents ratio problems to solve. Scholars use a variety of representations to respond to the questions. The problem set has pupils show how the...
EngageNY
Even and Odd Numbers
Even or not, here I come. Groups investigate the parity of products and sums of whole numbers in the 17th lesson in a series of 21. Using dots to represent numbers, they develop a pattern for the products of two even numbers; two odd...
Other popular searches
- Reading Predicting Outcomes
- Predicting Outcomes Math
- Predicting Outcomes in Reading
- Ged Predicting Outcomes
- Outcomes Predicting
- Predicting Outcomes in Stories


