Curated OER
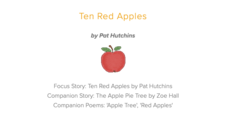
Ten Red Apples; The Five Senses
A clever lesson designed around an apple awaits your learners. Descriptive words are used to explain what they believe is inside a bag while using their five senses. Students read the story The Apple Pie Tree and are introduced to the...
EngageNY
Interpreting Residuals from a Line
What does an animal's gestation period have to do with its longevity? Use residuals to determine the prediction errors based upon a least-square regression line. This second lesson on residuals shows how to use residuals to create a...
American Statistical Association
Scatter It! (Predict Billy’s Height)
How do doctors predict a child's future height? Scholars use one case study to determine the height of a child two years into the future. They graph the given data, determine the line of best fit, and use that to estimate the height in...
Pennsylvania Department of Education
What is the Chance?
Fourth and fifth graders make predictions using data. In this analyzing data lesson plan, pupils use experimental data, frequency tables, and line plots to look for patterns in the data in order to determine chance. You will need to make...
Radford University
Modeling the Number of Starbucks Stores
Drink your coffee, then marvel over the rise of Starbucks. Scholars use provided data on the number of Starbucks stores from 1987 through 2014 to create scatter plots. They then determine the equation for the curve that best fits the...
EngageNY
Calculating Conditional Probabilities and Evaluating Independence Using Two-Way Tables (part 2)
Without data, all you are is another person with an opinion. Show learners the power of statistics and probability in making conclusions and predictions. Using two-way frequency tables, learners determine independence by analyzing...
EngageNY
Normal Distributions (part 2)
From z-scores to probability. Learners put together the concepts from the previous lessons to determine the probability of a given range of outcomes. They make predictions and interpret them in the context of the problem.
Curated OER
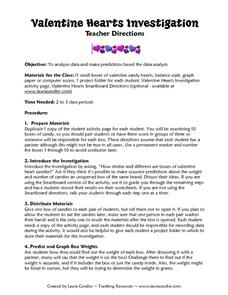
Valentine Hearts Investigation
Students practice analyzing data and making predictions. For this 2nd - 3rd grade lesson plan, students investigate and compare data gathered using boxes of valentine candy hearts. Students examine the different boxes of candy...
Curated OER
Applied Science - Science and Math Lab
Students make a prediction. In this applied science lesson, students guess the number of items in a jar. Students create a bar graph to show the predictions and the actual amounts.
EngageNY
Informally Fitting a Line
Discover how trend lines can be useful in understanding relationships between variables with a lesson that covers how to informally fit a trend line to model a relationship given in a scatter plot. Scholars use the trend line to make...
MENSA Education & Research Foundation
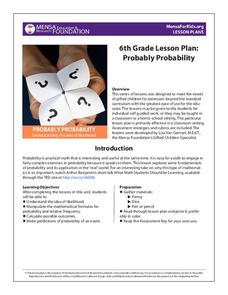
Probably Probability
Reinforce the concept of probability with a series of lessons highlighting the idea of likelihood, probability formulas, relative frequency, outcomes, and event predictions. The collection is made up of four lessons offering informative...
Charleston School District
The Line of Best Fit
If it's warm, they will come! Learners find a line of best fit to show a relationship between temperature and beach visitors. Previous lessons in the series showed pupils how to create and find associations in scatter plots. Now, they...
Raytheon
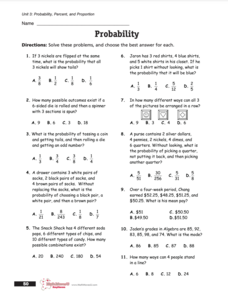
Probability, Percent, and Proportion
In this probability and predictions learning exercise, students read 1 page of facts, then solve 8 pages of problems related to probability, with answers keys included.
Curated OER
Bears in a Box
First graders count bears to predict missing addends. They analyze the missing addend sentence: 7 + ? = 10 and count up from 7 to 10 and check to see if there are 3 bears in the box.
Curated OER
Shape Pattern Prediction
In this shape pattern practice learning exercise, students examine 12 lines of shape patterns and then identify the shapes that continue each of the patterns.
American Statistical Association
Scatter It! (Using Census Results to Help Predict Melissa’s Height)
Pupils use the provided census data to guess the future height of a child. They organize and plot the data, solve for the line of best fit, and determine the likely height and range for a specific age.
PBL Pathways
Students and Teachers
Predict the future of education through a mathematical analysis. Using a project-based learning strategy, classes examine the pattern of student-to-teacher ratios over a period of years. Provided with the relevant data, learners create a...
Curated OER
When Will We Ever Use This? Predicting Using Graphs
Here are a set of graphing lessons that have a real-world business focus. Math skills include creating a scatter plot or line graph, fitting a line to a scatter plot, and making predictions. These lessons are aimed at an algebra 1 level...
Achieve
Ivy Smith Grows Up
Babies grow at an incredible rate! Demonstrate how to model growth using a linear function. Learners build the function from two data points, and then use the function to make predictions.
101 Questions
Toothpicks
Analyze patterns and build functions. Young scholars work on their modeling skills with an inquiry-based lesson. After watching a video presentation of the problem, they write functions and make predictions.
Curated OER
Make Ten Bundles
How many rolls until you get to 100? Young mathematicians will have a blast with this place value game, which has them rolling a die and placing a corresponding number of popsicle sticks in the "ones" column of their mat. Once they get...
Curated OER
Hands On: Make Predictions
In this making predictions worksheet, students use the line graph for marble numbers and colors to help them answer the questions about making predictions.
Curated OER
High School Mathematics Problems from Alaska: Predicting Plant Coverage
Students participate in simulation as they examine vegetation in a square meter land plot. Students construct charts and a key to make predicitons about other land plots.
Curated OER
Predicting the Future
Students examine how scientists predict the effects of global climate change. In this environmental science lesson, students participate in a discussion about using computer generated data to create climate predictions. Students examine...
Other popular searches
- Reading Making Predictions
- Pictures Story Predictions
- Lesson on Making Predictions
- Reading Predictions
- Literary Predictions
- Predictions in Reading
- Predictions and Probability
- Making Predictions Worksheet
- Story Predictions
- Inferring Meaning Prediction
- Hurricane Prediction
- Prediction Science


