Curated OER
Hands On: Make Predictions
In this making predictions worksheet, students use the line graph for marble numbers and colors to help them answer the questions about making predictions.
Curated OER
Make a Pass at Me
Students identify different types of functions and units of measurements. In this statistics lesson plan, students will collect data, graph their data and make predictions about their data. They plot a linear regression graph.
Virginia Department of Education
May I Have Fries with That?
Not all pie graphs are about pies. The class conducts a survey on favorite fast food categories in a lesson on data representation. Pupils use the results to create a circle graph.
Curated OER
Drive the Data Derby
Three days of race car design and driving through the classroom while guessing probability could be a third graders dream. Learn to record car speed, distances traveled, and statistics by using calculation ranges using the mean, median,...
EngageNY
Modeling a Context from Data (part 2)
Forgive me, I regress. Building upon previous modeling activities, the class examines models using the regression function on a graphing calculator. They use the modeling process to interpret the context and to make predictions based...
Virginia Department of Education
Linear Curve of Best Fit
Is foot length to forearm length a linear association? The class collects data of fellow scholars' foot length and the length of their forearms. They plot the data and find a line of best fit. Using that line, they make predictions of...
California Academy of Science
California's Climate
The United States is a large country with many different climates. Graph and analyze temperature and rainfall data for Sacramento and Washington DC as you teach your class about the characteristics of Mediterranean climates. Discuss the...
EngageNY
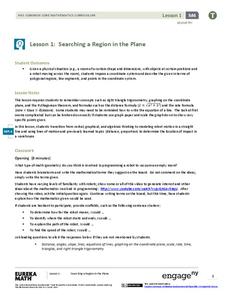
Searching a Region in the Plane
Programming a robot is a mathematical task! The activity asks learners to examine the process of programming a robot to vacuum a room. They use a coordinate plane to model the room, write equations to represent movement, determine the...
Radford University
Modeling Statistical Data
Can people predict the number of future divorces? Scholars research and analyze data on the number of divorces and teenage pregnancies in Virginia over time. They use the data to create graphs, determine the best-fit equations, and make...
Curated OER
Favorite Food
Students are given three choices of food. They then decide on their favorite and predict what the class's favorite food will be. After the teacher enters the data into the computer, students gather around the computer to view the...
Curated OER
Matchstick Math: Using Manipulatives to Model Linear, Quadratic, and Exponential Functions
Playing with matches (unlit, of course) becomes an engaging learning experience in this fun instructional unit. Teach pupils how to apply properties of exponential functions to solve problems. They differentiate between quadratic and...
Radford University
Got Slope?
Go around and around with slope. The class investigates tornadoes by watching videos, building a homemade tornado, and performing research on the Storm Prediction Center website. Groups gather data and create scatter plots for twisters...
Curated OER
Data and Probability: What is the Best Snack?
In this math/nutrition lesson, the nutritional value of 3 snack foods is recorded on a data chart and represented on a bar graph. Students analyze and compare information, construct data charts and related bar graphs, and draw...
National Security Agency
It's Probably Probable
Learners make predictions and draw conclusions from given information as they learn the meaning of probability in this vocabulary-rich, integrated activity that presents a variety of teaching strategies to motivate and reach all learning...
Curated OER
Monster Data
An inventive lesson shows learners how to collect, organize, and present mathematical data. They access websites which lead them through a variety of ways to engage in data collection. They get to design and create graphs, and present...
Curated OER
Weather, Data, Graphs and Maps
Students collect data on the weather, graph and analyze it. In this algebra lesson, students interpret maps and are able to better plan their days based on the weather reading. They make predictions based on the type of clouds they see.
Curated OER
Real Misleading Graphs
Students identify real graphs and misleading graphs. In this algebra lesson, students surf the Internet for real life scenarios where graphs are used in a misleading way as well as in a correct way.
Curated OER
Baseball Relationships - Using Scatter Plots
Students use graphing calculators to create scatter plots of given baseball data. They also determine percentages and ratios, slope, y-intercepts, etc. all using baseball data and statistics.
Curated OER
Little Boy Blue
First graders read nursery rhymes and celebrate Mother Goose. In this drawing conclusions and predicting lesson, 1st graders create new ending for the nursery rhymes. Students gather data and make a graph showing their favorite rhyme.
Curated OER
Graphing Difference
Students use problem solving skills to reason, predict and problem solve through exploration. They recognize a way in which they are different from their peers and create a graph that shows these differences.
David Pleacher
Candy Math Fun
Few things can motivate children to learn like the promise of a sweet and tasty treat. Given a bag of M&M®s, Skittles®, or other colorful candy, students first predict the contents of the bag before counting the pieces, creating a...
Colorado State University
If You Can't Predict the Weather, How Can You Predict the Climate?
Why is the weather man wrong so often? Young climatologists discover how chaos rules both weather and climate through a math-based activity. Using an iterative equation, the class examines how small day-to-day weather events total up to...
EngageNY
Modeling Riverbeds with Polynomials (part 2)
Examine the power of technology while modeling with polynomial functions. Using the website wolfram alpha, learners develop a polynomial function to model the shape of a riverbed. Ultimately, they determine the flow rate through the river.
EngageNY
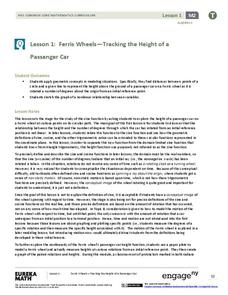
Ferris Wheels—Tracking the Height of a Passenger Car
Watch your pupils go round and round as they explore periodic behavior. Learners graph the height of a Ferris wheel over time. They repeat the process with Ferris wheels of different diameters.


