Stats Monkey
Everything I Ever Needed to Learn about AP Statistics I Learned from a Bag of M and M's®
Candy is always a good motivator! Use this collection of M&M's® experiments to introduce statistics topics, including mean, standard deviation, nonlinear transformation, and many more. The use of a hands-on model with...
Illustrative Mathematics
Waiting Times
Probability prevails in this assignment as youngsters determine the probability of finding a blue pen in a cereal box when they can come in blue, green, yellow, or red. Learners set up a simulation to determine the outcome of compound...
Illustrative Mathematics
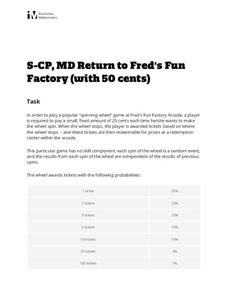
Return to Fred's Fun Factory (with 50 Cents)
The penny arcade gets the statistics treatment in this fun probability investigation. A non-standard game of chance is described and then the class is set loose to find missing probabilities, determine common outcomes, and evaluate...
Curated OER
Pi Day: The Other Math Holiday!
Happy Pi Day! This collection of games, experiments, and activities leads participants through an exploration of the many aspects and attributes of that mysterious quantity, pi. Activities range from using statistical...
Centre for Innovation in Mathematics Teaching
Ten Data Analysis Activities
This thirteen page data analysis worksheet contains a number of interesting problems regarding statistics. The activities cover the concepts of average measurements, standard deviation, box and whisker plots, quartiles, frequency...
Curated OER
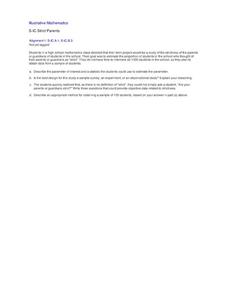
Strict Parents
Are your parents or guardians strict? That's an interesting question many of your pupils are probably interested in discussing. How do you design a study directed at your high schooler to gain insight into that question? How do you...
Howard Hughes Medical Institute
Mendelian Genetics, Probability, Pedigree, and Chi-Square Statistics
People with the sickle cell trait, but not sickle cell disease, find natural protection against malaria. Scholars consider various combinations of genotypes and environmental factors to determine if children might have sickle cell...
Illustrative Mathematics
Accuracy of Carbon 14 Dating II
The scientific issue of carbon-14 dating and exponential decay gets a statistics-based treatment in this problem. The class starts with a basic investigation of carbon content, but then branches out to questions of accuracy and...
US Department of Commerce
The New Normal
Don't be normal ... be exceptional in understanding statistics. Pupils analyze six different sets of census data using histograms or normal probability plots to determine whether each data set fits a normal distribution. They then get...
Education Development Center
Creating Data Sets from Statistical Measures
Explore the measures of central tendency through a challenging task. Given values for the mean, median, mode, and range, collaborative groups create a set of data that would produce those values. They then critique other answers and...
Education Development Center
Interpreting Statistical Measures—Class Scores
Explore the effect of outliers through an analysis of mean, median, and standard deviation. Your classes examine and compare these measures for two groups. They must make sense of a group that has a higher mean but lower median compared...
101 Questions
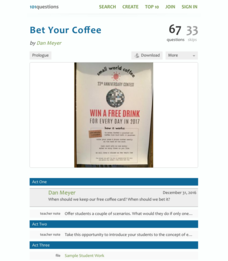
Bet Your Coffee
Coffee drinkers, rejoice, here's a chance to win free coffee! Coffee club card holders have the chance to win free coffee every day for a year—but they must enter using their cards good for a free cup. Scholars weigh the chances of...
Curated OER
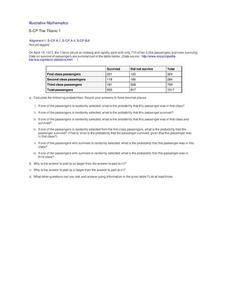
The Titanic 1
Were your chances of surviving the sinking of the Titanic better if you were a first-class passenger? Capture learners' attention with actual historical data to find the answer. They use two-way tables to calculate conditional and...
Curated OER
The Titanic 3
Can survival rates on the Titanic be explained by the "women and children first" policy or did rescue procedures favor the wealthy? Use actual historical data to explore conditional probability and independent events with your class....
Illustrative Mathematics
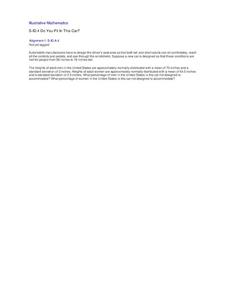
Do You Fit In This Car?
A short activity that focuses on the normal distribution as a model for data distribution. Using given means and standard deviations, your budding statisticians can use statistical tables, calculators, or other statistical software to...
Curated OER
Estimating the Mean State Area
Seventh grade statisticians randomly select five states and then determine the mean area. The class then works together to create a dot plot of their results.
David Pleacher
Candy Math Fun
Few things can motivate children to learn like the promise of a sweet and tasty treat. Given a bag of M&M®s, Skittles®, or other colorful candy, students first predict the contents of the bag before counting the pieces,...
Curated OER
The Titanic 2
Did the rescue procedures on the Titanic favor the first-class passengers? Use actual historical data to explore independent and dependent events with your class. Part of a series of worksheets, but can be used separately.
Curated OER
Breakfast Before School
Are the events "I eat breakfast" and "I am late for school" independent events? Assess learners' understanding of independence in a simple context with this short worksheet. Use as an opener, as part of an assignment, or discuss together...
Federal Reserve Bank
FRED in the Classroom: Employment and the Labor Force
Acquaint your class members with data sources for employment in the United States and help them gain a better understanding of a vital measure of our economy's health.
National Council of Teachers of Mathematics
Eruptions: Old Faithful Geyser
How long do we have to wait? Given several days of times between eruptions of Old Faithful, learners create a graphical representation for two days. Groups combine their data to determine an appropriate wait time between eruptions.
Curated OER
M&M Science and Math
A series of math and science activities feature M&M's® as manipulatives to help kids work through equations. The resource includes exercises on finding averages, percent of compositions, moles in chemical reactions, genotypes and...
Education Development Center
Choosing Samples
What makes a good sample? Your classes collaborate to answer this question through a task involving areas of rectangles. Given a set of 100 rectangles, they sample a set of five rectangles to estimate the average area of the figures. The...
Curated OER
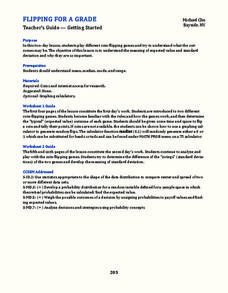
Flipping for a Grade
What happens when your teachers get tired of grading tests and want to use games of chance to determine your grade? How would you decide which game they should play? Learn how to use expected value and standard notation to compare two...


