Illustrative Mathematics
Find the Change
This exercise is an opportunity for algebra learners to understand the connection between the slope of a line and points found on the line. Use similar triangles to explain why slope m is the same between any two points. Discuss with the...
Illustrative Mathematics
DVD Profits, Variation 1
The idea in the resource is to understand the connections between proportional relationships, lines, and linear equations. To stay within the context of the standard, skip the part of the resource that solves with unit rates. Instead,...
Illustrative Mathematics
Distance across the channel
Here you will find a model of a linear relationship between two quantities, the water depth of a channel and the distance across the channel at water level. The cross section of the channel is the shape of an isosceles trapezoid. The...
Curated OER
Heart Rate Monitoring
Algebra learners like this resource because it is easy to understand and it relates to their lives. Whether you are starting a new workout routine, or just climbing the stairs, your heart rate increases and decreases throughout the day....
Illustrative Mathematics
Chicken and Steak, Variation 2
Many organizations put on barbecues in order to make money. In a real-world math problem, the money allotted to purchase steak and chicken at this barbecue is only one hundred dollars. It is up to your potential chefs to figure out how...
Illustrative Mathematics
Velocity vs. Distance
At the end of this activity, your number crunchers will have a better understanding as to how to describe graphs of velocity versus time and distance versus time. It is easy for learners to misinterpret graphs of velocity, so have them...
101 Questions
Snow Day
Who doesn't like a snow day? Learners watch a snow accumulation over a span of 10 hours. They use that information to make a prediction of the total snow that fell during the 23-hour snowfall. Will it be enough to cancel school?
PBS
The Lowdown — Poverty Trends: What Does It Mean to Be Poor in America?
Here's a resource that's rich with learning opportunities. Future mathematicians investigate the poverty rate in America over time. They use an interactive to compare the poverty rate during the Great Recession of 2008 to other years,...
Illustrative Mathematics
Introduction to Linear Functions
Introduce your algebra learners to linear and quadratic functions. Learners compare the differences and relate them back to the equations and graphs. Lead your class to discussions on the properties of a function or a constant slope...
Ms. Amber Nakamura's Mathematics Website
Algebra Project
What would your dream house look like? A cottage? A medieval castle? High schoolers enrolled in Algebra design the perfect house while using slopes to write equations for various aspects of the project.
Teach Engineering
Matching the Motion
It is not always easy to walk the straight and narrow. In the sixth portion of a nine-part unit, groups actively recreate a graph depicting motion. Individuals walk toward or away from a motion detector while trying to match a given...
Mathematics Common Core Toolbox
Golf Balls in Water
Here's a resource that models rising water levels with a linear function. The task contains three parts about the level of water in a cylinder in relationship to the number of golf balls placed in it. Class members analyze the data and...
PBL Pathways
College Costs
Predict the year that college costs will double in your state using linear modeling. The first part of this two-part project based learning activity asks young mathematicians to use data from the College Board. They graph the data,...
PBL Pathways
College Costs 2
What is the financial benefit for attending a community college for the first two years before transferring to a four-year college? The second part of the educational lesson asks young scholars to explore this question through data...
National Council of Teachers of Mathematics
Varying Motion
For this secondary mathematics learning exercise, high schoolers collect data based on a person’s motion. From this data, learners create graphs comparing displacement, velocity, and acceleration to time. The five-page learning exercise...
Foundation for Water & Energy Education
How is Flowing Water an Energy Source? Activity C
Can the force of falling water through a tube vary by altering the diameter of the tube or its height? That is what physical scientists aim to discover in this activity, the third in successively more revealing activities on the power of...
101 Questions
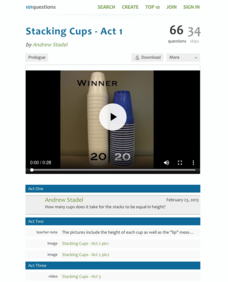
Stacking Cups
Facilitate an understanding of equality using a modeling task. After watching different-sized cups being stacked, learners use their math skills to determine when the height of each cup tower will be the same. Meant as an introduction to...
Texas Instruments
Texas Instruments: Linear Functions: Slope as Rate of Change
Students learn to associate the slope of a straight line with a constant rate of change. They also learn to calculate the rate of change from data points on a line, using the correct units. Students also learn to read from a linear...
Paul Dawkins
Paul's Online Notes: Tangent Lines and Rates of Change: Practice Problems
This section introduces two problems: rate of change of a function and tangent lines to functions. Both of these problems will be used to introduce the concept of limits.
Texas Instruments
Texas Instruments: Rate of Change
This activity is designed for students who have already learned the definition of the derivative and that it can be used to determine the slope of a curve. (Continued. See "before the activity.")
Rice University
Rice University: Cynthia Lanius: Stressed Out: Slope as Rate of Change
This site may be used as a lesson for understanding graphs of functions and goes into slopes of a curve. The site helps students notice when a slope of a curve is increasing and decreasing and general interpretations of graphs.
Texas Instruments
Texas Instruments: A Steep Hike Adventure 3
Students use the CBR 2 to gather distance and time data for various walking speeds. They observe the effect of change in direction and speed of motion on distance versus time graphs. Students interpret and analyze graphs, calculate slope...
Texas Instruments
Texas Instruments: Walking the Line
In this activity, students use linear functions to model and solve problems in situations with slope and a constant rate of change. They learn to represent situations with variables in expressions, equations, and inequalities and use...
Texas Instruments
Texas Instruments: Sack Race
The primary focus should be on slope as rate of change and piecewise functions. This activity allows exploration of multiple types of slope; i.e., positive slope, negative slope, or zero slope for students to build their understanding of...


