Curated OER
Approaching Limits
With the assistance of their Ti-84/Ti-83 Plus calculators, students develop a foundation for the limiting process as well as estimate limits from graphs and tables of values. They view how a function behaves as the input approaches a...
Willow Tree
Simplifying Square Roots
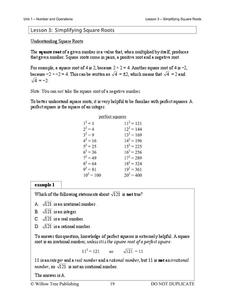
The square root of five and five do not have the same value! How many times have you addressed this with math classes? A instructional activity gives an explanation of a square root and gives examples for simplifying square root...
Curated OER
Skeleton Tower
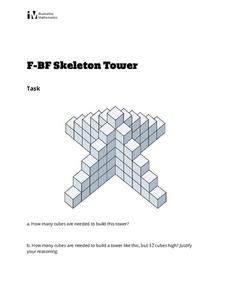
Your algebra learners build a quadratic function in this task of counting the blocks used to build objects. The arithmetic sequence that shows up brings up a shortcut to the long addition using the Gauss Method. Eventually, learners...
EngageNY
What Is Area?
What if I can no longer justify area by counting squares? Lead a class discussion to find the area of a rectangular region with irrational side lengths. The class continues on with the idea of lower approximations and upper...
Illustrative Mathematics
Fruit Salad
Playing with values in this fruit salad problem allows learners to find out how many cherries were mixed in. Your middle schoolers can organize their thoughts in a chart before going into the equation. Eigth graders can skip the chart...
Illustrative Mathematics
Walk-a-thon 1
Your mathematician's job is to explore the relationship between hours and miles walked during a walk-a-thon. The activity compels your learners to experiment with different means in finding out this proportional relationship. The answer...
EngageNY
Modeling with Quadratic Functions (part 2)
How many points are needed to define a unique parabola? Individuals work with data to answer this question. Ultimately, they determine the quadratic model when given three points. The concept is applied to data from a dropped object,...
Curated OER
Numbers for Students
Pupils construct sets of numbers up to 10, write the numerals up to 10, and count up to 10 rationally. They use ten frames and also make bean sticks. Communication is the Process Standard featured in this lesson. Finally, students record...
Illustrative Mathematics
It's Warmer in Miami
Brrrr it's cold in Alaska! When given the temperatures of Anchorage and Miami in the winter, your mathematicians will calculate how much warmer it is in Miami. Answer key provides two different solution choices. Great as a warm-up for...
Curated OER
Basketball
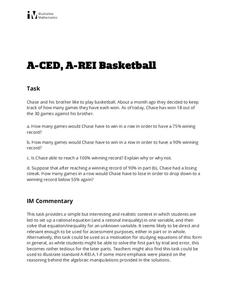
Tap into the competitive nature of teenagers as your class practices setting up and solving rational equations. This activity starts with a specific ratio of games won to games played, then asks how many more games must be played to...
PB Works
Numbers Lesson 3 - Hershey Bar Fractions
Talk about delicious math! Pupils solve problems involving rational numbers and analyze real-life problems to find solutions in a pre-algebra class. They discuss the sections of a Hershey's bar in terms of fractions and decimals before...
Curated OER
Does Sunlight Effect Leaf Size?
Students make estimates and then measure leaves for accuracy. They calculate the area of the leaves by drawing an outline on graph paper and counting the squares. They compare the leaves exposed to sunlight to those that are in constant...
Curated OER
Exploring Vertical Asymptotes
Scholars identify the domain of a rational function in this precalculus lesson. They identify the removable discontinuity and label what will make the denominator zero. Learners also describe properties of the graph as it relates to the...
Curated OER
Discriminating Against the Zero
Learners explore the concept of quadratic equations. In this quadratic equations lesson, students find the roots or zeros of quadratic equations using the quadratic formula. Learners give examples of functions with 2 real, rational...
Curated OER
Pythagorean Relationships
Oh that Pythagorean Theorem is so useful. Learners engage in a 45 minute learning activity that requires them to solve for missing angles and sides of a right triangle. They'll use the Pythagorean Theorem to find the rations of sides and...
Curated OER
Fishing for numbers
Students participate in a lesson in order to reinforce the numbers 0-10, and will also allow the students to practice their counting. Number recognition and the understanding of number size (magnitude) is increased also.
Curated OER
Zeros of Polynomials
Young scholars graph polynomials. In this Algebra II lesson, students investigate the graph of a polynomial to determine the value and the number of zeros. This lesson requires the use of a graphing calculator.
Curated OER
How Many Bears in the Forest?
Third graders model the tag and recapture of bears and use proportions to estimate the population of the bears in their forest. This is a statistical sampling method used by scientists and naturalists to determine population numbers.
Curated OER
Crossing the Asymptote
Students investigate graphs and their asymptotes. In this precalculus lesson, students examine the numerator and denominator of their rational functions. This helps them identify where and when the graph will cross its asymptote.
Curated OER
Cuisenaire Fractions
Students study fractions by comparing rations using Cuisenaire rods. They make predictions, measure lengths using Cuisenaire rods and explain their answers. Next, they discuss the relationship of the different rods in terms of their...
Curated OER
Math & Social Science
Students are given data and are to calculate averages and yearly totals of how many cars travel the Tacoma Narrows Bridge. They also make a graph of the data.
Curated OER
Worksheet 8: Functions and Falling Bodies
In this math worksheet, students answer 6 questions having to do with continuous and differentiable functions, falling bodies, and derivatives.
Curated OER
"Reviewing Facts Through 10" Lesson Plan
Explore the joy of math with you little learners! They practice creating math problems with numbers from a fact family using numbers 1-10. They work independently with a set of connecting cubes to aid them in creating number sentences...
Illustrative Mathematics
Walk-a-thon 2
During a walk-a-thon your learners must determine the walking rate of Julianna's progress. Using tables, graphs, and an equation, they must be able to calculate the time it took her to walk one mile and predict her distance based on the...
Other popular searches
- Rational Counting to 15
- Rational Counting 15
- Rational Counting Principles
- Rational Counting Transport


