CK-12 Foundation
Intercepts by Substitution: Finding a Linear Product Using a Quadratic
Discover another way to interpret multiplication. Using an interactive, learners slide points (representing the factors of multiplication) along the x-axis of the graph of y = x^2 and observe changes in the line segment connecting the...
CK-12 Foundation
Graphs in the Coordinate Plane: Functions on a Cartesian Plane
Connect the dots to graph a linear function. Young mathematicians use an interactive to first plot provided points on a coordinate plane. They connect these points with a line and then answer questions about the slope and y-intercept of...
CK-12 Foundation
Function Rules based on Graphs: Making Money in the Hat Business
Hats off to those learning about the graphs of functions. Individuals use an interactive to plot points representing profits for a hat business. They identify a quadratic equation to represent this function and answer challenge questions...
CK-12 Foundation
Graphs Using Slope-Intercept Form: Zip-Line
Zip lines aren't so scary when all your scholars use them for is math. Young mathematicians see how the slope of a zip-line to a building changes as the height changes. They answer a set of challenge questions regarding the scenario.
EngageNY
Interpreting the Graph of a Function
Groups sort through NASA data provided in a graphic to create a graph using uniform units and intervals. Individuals then make connections to the increasing, decreasing, and constant intervals of the graph and relate these connections...
CK-12 Foundation
Misleading Graphs (Identify Misleading Statistics): Are Virgos Cursed?
Is it safe to take data at its face value? Pupils use the interactive to evaluate a claim that Virgos are more likely to get into a car crash than others. Individuals determine whether another variable may be at play.
Curated OER
Graphing
Intended for a faith-based classroom, this lesson requires second graders to create a survey, conduct the survey in multiple classrooms, and graph the results. They can choose between creating a picture or bar graph, or you can require...
Virginia Department of Education
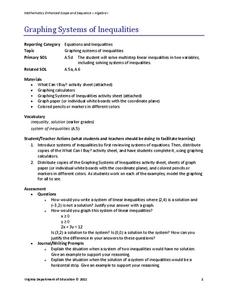
Graphing Systems of Inequalities
Apply systems of inequalities to a real-world problem. Here, scholars learn to graph solutions to systems of linear inequalities. To finish the instructional activity, they solve a problem involving burgers and cheeseburgers using a...
CK-12 Foundation
Multiple Bar Graphs
I scream, you scream, we all scream for ice cream bar graphs. Pupils create a multiple bar chart to represent the sales of ice cream products during the first week of summer. Using the chart, learners find the day that each of the...
CK-12 Foundation
Interpretation of Circle Graphs: Northwest Region Population Pie
Given populations of the five Northwestern states, learners create a circle graph. Using the data and the pie chart, they make comparisons between the populations of the states. Finally, the pupils determine how the chart will change...
CK-12 Foundation
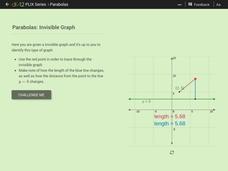
Parabolas: Invisible Graph
Envision the function as the point swings. Given a point connected to another point and a line, pupils trace through an invisible graph. Learners identify the name of the given point and the line and determine the type of conic section...
CK-12 Foundation
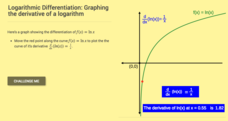
Logarithmic Differentiation: Graphing the Derivative of a Logarithm
Log the values of the derivative of a logarithm. The interactive plots the derivative of the natural logarithm. Learners first determine the derivative of natural logarithm and the general logarithm. Using the formulas for the...
CK-12 Foundation
Graphs of Absolute Value Equations: Absolute Value Distance
The sole purpose of this interactive is to graph a function representing the distance of a car from a shoe store. Scholars use an interactive to graph such an absolute value function. They then answer a set of challenge questions...
CK-12 Foundation
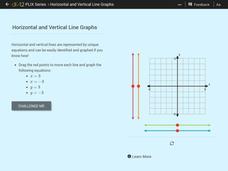
Horizontal and Vertical Line Graphs
See how vertical and horizontal lines have special equations. Scholars drag vertical and horizontal lines onto a coordinate plane to graph given equations. They then answer a set of challenge questions on the topic.
Curated OER
The Hot Dog Stand - An Annual Report
Students run a computer simulation and collect data as they work and use the data to create an annual report for their business. It is desirable for students to do this project individually, but it could be done as a class using a large...
Curated OER
Which Graph is best?
Students use commercial software to organize and visually display data to draw conclusions; students use graphing software to create several types of graphs illustrating the number of each color of M&M's in one bag.
PBL Pathways
Students and Teachers 2
Examine trends in student-to-teacher ratios over time. Building from the first task in the two-part series, classes now explore the pattern of student-to-teacher ratios using a non-linear function. After trying to connect the pattern to...
Achieve
Rabbit Food
Keep your pets slim, trim, and healthy using mathematics! Pupils use a linear programming model to optimize the amount and type of food to provide to a pet rabbit. They model constraints by graphing inequalities and use them to analyze a...
Balanced Assessment
Cost of Living
Math scholars investigate the cost of living in Hong Kong compared to Chicago but must first convert the different types of currency. They then choose a type of graph to compare different spending categories and finish the activity by...
CK-12 Foundation
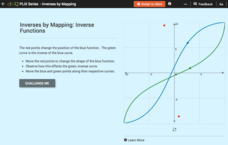
Inverses by Mapping: Inverse Functions
Map your way to successfully understanding inverse functions. Pupils use an interactive map to investigate how changes in the graph of a function affect the graph of its inverse. The results of the activity lead to the conclusion that...
CK-12 Foundation
Input-Output Tables for Function Rules
How does changing a graph affect the function? Learners watch the changing input-output table as they adjust the location of the line graph. Questions prompt them to complete a table of values and determine the function rule.
Curated OER
Application of Graph Theory
Students investigate different online tutorials as they study graphing. For this graphing lesson, students apply the concept of graphs cross curricular and use it to make predictions. They define the purpose and theories behind graphs.
Curated OER
Statistics for Graphing
Students use the Internet to access a variety of websites that present statistics and information for use in graphing. They represent sports statistics, geographical measurements, temperatures and more.
Del Mar College
Solving Systems of Equations
Lets keep the system working and show learners the three ways to solve linear systems of equations. Each method includes step-by-step instructions to work their way through the problem. The same problem is used for each method to show...


