Curated OER
Reading Primary Source Documents: Historical Content
Why do we read primary source documents? What can they give us that other writings cannot? Provide your learners with any of the primary sources attached here (there are seven), and have them complete the graphic organizer (which opens...
Curated OER
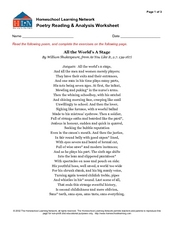
Poetry Reading and Analysis Worksheet - As You Like It
Enhance your lesson on Shakespeare with this poetry activity. After reading lines 139-167 from As You Like It Act II, Scene 7 (provided on the first page), middle schoolers work on a graphic organizer to paraphrase each part of the poem....
Curated OER
Position Within a Set
Your students will have no problem relating to this word problem involving a toy car race: there are three cars, and they come in first, second, and third place in a race down the driveway. Learners analyze the data by writing the...
Howard Hughes Medical Institute
Gorongosa: Scientific Inquiry and Data Analysis
How does the scientific process begin? Introduce ecology scholars to scientific inquiry through an insightful, data-driven lesson. Partners examine data from an ongoing research study to determine the questions it answers. The resource...
Howard Hughes Medical Institute
Lesson 8: WildCam Gorongosa Data Analysis
How do scientists analyze data to get a specific answer to a question? The final chapter in an eight-part series of activities centered around Gorongosa National Park encourages scholars to dig deeper into the scientific process. After...
Curated OER
Data Analysis and Probability: Graphing Candy with Excel
Collect and graph data using Microsoft Excel with your math class. They will make predictions about the number of each colored candy in a bag of M&M's, then sort, classify, count, and record the actual data before using Excel to...
Curated OER
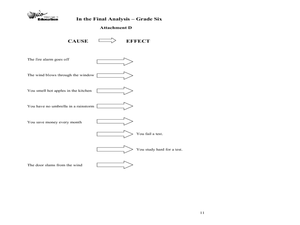
The Final Analysis: Cause and Effect, Fact and Opinion
Middle schoolers read and review informational texts, analyze cause and effect, and distinguish fact from opinion. They assess a "one-minute mystery" you read aloud for cause and effect relationships. Resource includes complete set of...
Curated OER
Worksheet for Analysis of a Letter
Dear Nancy, how do you analyze a letter? Love, Trez. Dear Trez, you use a Letter Analysis Worksheet. Love, Nancy.
This richly detailed worksheet provides multiple questions that lead researchers step-by-step through the process of...
Curated OER
Literary Analysis: Summary vs. Analysis
What is the difference between summary writing and literary analysis? A 16-slide presentation offers some basic requirements for both types of writing and helps readers identify each based on keywords used in both types of writing....
Houghton Mifflin Harcourt
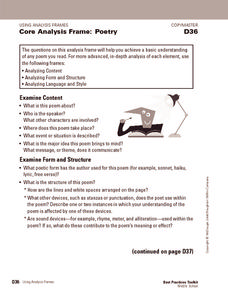
Core Analysis Frame: Poetry
Dig deep into any piece of poetry with a set of analysis questions. Ponder the content, form, and language of poetry and provide some question for critique. The first two pages include general questions, and the remainder of the document...
Curated OER
Human Population- Changes in Survival Rates Data Interpretation
In this human population changes in survival worksheet, students interpret and plot data to understand the differences in human mortality and survivorship between historic and modern times. They investigate how these changes influence...
Curated OER
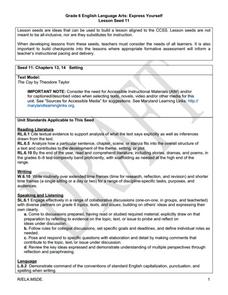
Express Yourself Lesson Seed 11: Setting
Encourage your learners to examine the setting in Theodore Taylor's The Cay. Pupils work in small groups to put together a description of the setting before reading two more chapters of the book. They use their double-entry journals to...
Curated OER
Grapes of Wrath: Setting up Historical Context
Discuss life in the 1930s in relation to the Dust Bowl and Great Depression, then do a cross-media analysis. Here you'll find background information on film maker John Ford, writer John Steinbeck, and 1930s America. You can compare the...
NASET
IEP Goals, & Objectives with Common Core State Standards
Creating IEP goals and aligning those goals with Common Core State Standards just got a whole lot easier. Designed for smart phones and tablets, this resource permits instructors and resource teachers to design programs for individuals,...
Mathematics Vision Project
Module 9: Modeling Data
How many different ways can you model data? Scholars learn several in the final module in a series of nine. Learners model data with dot plots, box plots, histograms, and scatter plots. They also analyze the data based on the data...
EngageNY
Analyzing a Data Set
Through discussions and journaling, classmates determine methods to associate types of functions with data presented in a table. Small groups then work with examples and exercises to refine their methods and find functions that work to...
EngageNY
Variability in a Data Distribution
Scholars investigate the spread of associated data sets by comparing the data sets to determine which has a greater variability. Individuals then interpret the mean as the typical value based upon the variability.
Education Development Center
Creating Data Sets from Statistical Measures
Explore the measures of central tendency through a challenging task. Given values for the mean, median, mode, and range, collaborative groups create a set of data that would produce those values. They then critique other answers and...
EngageNY
Summarizing a Data Distribution by Describing Center, Variability, and Shape
Put those numbers to work by completing a statistical study! Pupils finish the last two steps in a statistical study by summarizing data with displays and numerical summaries. Individuals use the summaries to answer the statistical...
Brigham Young University
Introducing the Text and Learning the Process of Script Analysis
Where do directors and set designers get their ideas so that the set they build creates the mood and atmosphere the director wants for a production? From the script! Introduce theater high schoolers to the script analysis techniques used...
Code.org
Making Data Visualizations
Relax ... now visualize the data. Introduce pupils to creating charts from a single data set. Using chart tools included in spreadsheet programs class members create data visualizations that display data. The activity encourages...
EngageNY
Using a Curve to Model a Data Distribution
Show scholars the importance of recognizing a normal curve within a set of data. Learners analyze normal curves and calculate mean and standard deviation.
Willow Tree
Dimensional Analysis
Convey to your pupils the importance of units, then show how to use dimensional analysis to perform a unit conversion. The math lesson includes detailed worked-out solutions to guide learners in their practice.
Curated OER
The Martian Chronicles: Concept Analysis
If you're planning on including Ray Bradbury's The Martian Chronicles in your science fiction unit, use a concept analysis guide to frame your instruction. It covers literary elements such as setting, narrative voice, and theme, as well...


