Curated OER
Computer Science: Pendulum
Students investigate the basic properties of pendulums as a function of spreadsheets. Working in groups, they measure the period for a pendulum at six different lengths and record the results. They prepare a file using Microsoft Excel...
Curated OER
Running a Business
Middle schoolers discuss spreadsheets and how they work. They then imagine they are owners of a store, determine twenty items that they would sell, and create spreadsheets to record amounts of each item sold in a two-week period. After...
Curated OER
Introduction to Computing and Project Development
Pupils use a computer and math to complete a science project. They review a brief history of computers as well as information on different operating formats will be included. In addition, students complete an overview of the hardware...
Curated OER
Drink It Up???
Students research and record facts about well, lake, and tap water. They increase their computer skills for research, creating a spreadsheet, and word processing.
Curated OER
Cloud Databases
Students complete a unit on clouds and a report about one type of cloud. They collect data through observation about different types of cloud cover and then create a spreadsheet to reflect their observations over a 2 week period.
Curated OER
Computer Science: Temperature
Students conduct an experiment on heat transfer and how it works. They record the temperature in whatever environment is surrounding the container and run experiments that use at least two different ambient temperatures. Students...
Curated OER
Fly Away With Averages
Students study mean, median, and mode. They construct paper airplanes and test them to see how far they fly. They measure the distance and then find the averages of their throws. They use spreadsheet software to record the data in a...
Council for Economic Education
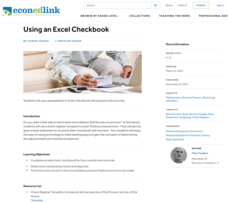
Using an Excel Checkbook
High school is the time that many scholars get their first jobs. Help young entrepreneurs apply economic principles to crucial skills for their new jobs and for functioning in society in general. They use Excel to balance a checkbook by...
Curated OER
Using Computer for Statistical Analysis
Students use the computer and S'COOL data for statistical analysis.
Curated OER
The Hot Dog Stand
Students run a computer simulation. They collect data as they work and use the data to create an annual report for their business. Several different simulations could be used for this project. It is desirable for students to do this...
Curated OER
Create Your Geometry Crossword
Learners learn how to identify cell addresses, format cell contents, add pop-up comments to a cell, and also apply conditional formatting. They use clues and words to make a geometry crossword puzzle pertaining to geometrical shapes.
Curated OER
Do Bigger Pumpkins Always Have More Seeds Than Smaller Pumpkins?
Second graders, in groups, predict the weight of a pumpkin and the number of seeds it might have. Then they find and record the actual weight and actual number of seeds. They compare and contrast the size of the pumpkin to the number of...
Curated OER
Graphing Using Excel
Fifth graders complete a series of graphs by gathering information and using Excel to graph the information. In this graphing lesson plan, 5th graders graph favorite desserts of the class. Student put their results into the computer and...
Curated OER
Banquet Menu Assessment: Exposure Investigation Exercise
Learners identify sources of Food Borne illness and their prevention. They formulate hypotheses based on collected information. Pupils become aware of Nutrintional value of food. Students collected data are synthesized to formulate...
Curated OER
Data! Data! Graph that Data!
Fifth graders create data graphs using Microsoft Excel. For this data collection lesson, 5th graders create and conduct a survey, then use Excel to organize and graph their data.
Curated OER
How many seeds?
Students investigate seeds and find the difference between seeds and nuts. In this seeds and nuts lesson, students predict, then count the number of seeds in an apple. Students record and share their results. Students compare seeds to...
Curated OER
Lemonade Business
Twelfth graders use all features of Microsoft Excel and Microsoft Power Point to create charts and graphs. They use charts and graphs to make a Power Point Presentation.
Curated OER
Excel temperature Graphs
Learners gather data about the weather in Nome, Alaska. In this Nome Temperature lesson, students create an excel graph to explore the weather trends in Nome. Learners will find the average weather and add a trend line to their graph.
Curated OER
My Community
First graders design a Powerpoint presentation to reflect information about their community. In this community lesson, 1st graders create slides to explain the weather, geography and other information about the city.
Curated OER
WORKING WITH WORKBOOKS
Learners work through problems in the textbook and teacher-made problems to reinforce the new learning. They turn in practice problems to instructor to be checked for accuracy and evidence of understanding
Curated OER
Embracing Diversity
Students explore and use different computer programs for collecting data. For this technology based lesson, students set up a survey and use the Excel and Lotus software to collect data.
Curated OER
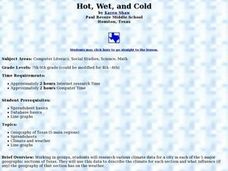
Hot, Wet, and Cold
Students research climate data for a city in each of the 5 major geographic sections of Texas. They use data to describe the climate and what influence the geography of that section has on the weather.
Curated OER
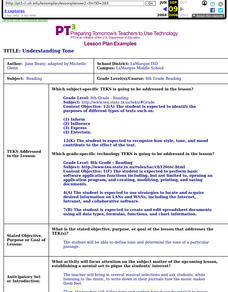
Understanding Tone
Eighth graders define tone and determine the tone of a particular passage making a web of tone words on Inspiration. They write a journal entry expressing how a piece of music makes them feel and create a PowerPoint to share.
Curated OER
PowerPoint Project for Creating a New Business
Pupils create a mock new business for which they design a PowerPoint presentation. They include company information, financial statements, graphs, advertising and management promotion pages in the final presentation.
Other popular searches
- Spreadsheets
- Excel Spreadsheets
- Budget Spreadsheet
- Favorite Foods Spreadsheet
- Microsoft Excel Spreadsheets
- Candy Wrapper Spreadsheet
- Basic Spreadsheet Skills
- Spreadsheet Lesson Plans
- Meteorology and Spreadsheets
- Using Excel Spreadsheets
- Amusement Park Spreadsheet
- Creating a Spreadsheet


