Math Solutions
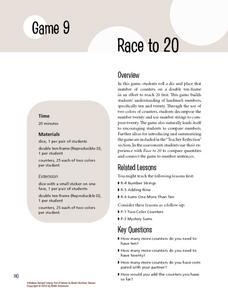
Race to 20
And they're off! Working in pairs, young mathematicians roll dice to see who can fill in their double ten-frames first. When students finally fill in their arrays, they create addition number sentences that represent their rolls, helping...
EngageNY
Analyzing Data Collected on Two Variables
Assign an interactive poster activity to assess your class's knowledge and skill concerning data analysis. The teacher reference provides solid questions to ask individuals or groups as they complete their posters.
EngageNY
Summarizing Bivariate Categorical Data with Relative Frequencies
It is hard to determine whether there is a relationship with the categorical data, because the numbers are so different. Working with a familiar two-way table on super powers, the class determines relative frequencies for each...
Teach Engineering
Determining Densities
Don't be dense—use a robust resource. The second installment of a five-part Floaters and Sinkers unit has learners determine the densities of several objects. As part of the activity, they learn the displacement method for finding...
EngageNY
Summarizing a Distribution Using a Box Plot
Place the data in a box. Pupils experiment with placing dividers within a data set and discover a need for a systematic method to group the data. The 14th instructional activity in a series of 22 outlines the procedure for making a...
Statistics Education Web
First Day Statistics Activity—Grouping Qualitative Data
Making groups of groups can help to organize data. Classes use statistics to group themselves using descriptive adjectives. The objective is for learners to understand that grouping qualitative data is useful when the original groups are...
Curated OER
Dog Pen Problem
Teach your class about various approaches to solving the problem of maximizing the area of a rectangle space with a fixed perimeter in the context of a farmer's dog pen. Then, they complete a worksheet independently to summarize the...
New York State Education Department
TASC Transition Curriculum: Workshop 4
Why is it important to use precise language? Participants explore this question in the fourth activity in a series of 15 on effective instruction. Perfect for all content areas, the activity promotes appropriate language choice through...
West Contra Costa Unified School District
Comparing Data Displays
There is so much more to data than just numbers, and this resource has learners use three methods of comparing data in a multi-faceted lesson. The 21-page packet includes a warm-up, examples, an activity, and assessment for a...
Virginia Department of Education
Distance and Midpoint Formulas
Small groups work through two guided activities to derive the distance and midpoint formulas for the coordinate plane. The activities begin with concrete examples and move to abstract.
02 x 02 Worksheets
Absolute Value Equations and Inequalities
Demonstrate the meaning of an absolute inequality using three different methods. Here, scholars explore absolute value inequalities through graphing, number line distance, and compound inequalities. Pupils complete various activities to...
American Statistical Association
A Sweet Task
Candy is always an effective motivator! A fun math activity uses M&M's and Skittles to explore two-way frequency tables and conditional probability. The candy can serve a dual purpose as manipulatives and experimental data.
EngageNY
Conditional Relative Frequencies and Association
It is all relative, or is it all conditional? Using an exploration method, the class determines whether there is an association between gender and superpower wish through the use of calculating conditional relative frequencies. The...
Curated OER
Cylinder: Student Worksheet
Pairs of geometry whizzes work together to determine which of three differently shaped cylinders will have the greatest volume. Pupils cut out the three rectangles embedded in the plan, and tape them together to form a cylinder. From...
American Statistical Association
The Mean and Variability from the Mean
Discover the mean from fair share to the balance point. The instructional activity takes small groups of pupils through two different interpretations of the mean, the fair share understanding of the mean, and the balance point. Scholars...
EngageNY
Sampling Variability in the Sample Proportion (part 2)
Increase your sample and increase your accuracy! Scholars complete an activity that compares sample size to variability in results. Learners realize that the greater the sample size, the smaller the range in the distribution of sample...
Southwest Educational Development Laboratory
Simple Machines
Simple doesn't mean useless. Individuals learn how simple machines benefit the user by changing the amount of effort. A seven-lesson unit begins with an overview of simple machines and then incorporates activities that allow the user to...
Georgetown University
Cup-Activity: Writing Equations From Data
Determine how cup stacking relates to linear equations. Pupils stack cups and record the heights. Using the data collected, learners develop a linear equation that models the height. The scholars then interpret the slope and the...
K20 LEARN
Decomposers—Fraction Style: Fractions
"What are fractions composed of?" is the essential question of a lesson designed to enhance understanding and strengthen the foundation of adding fractions. Mathematicians start by discussing what makes an equation true or false,...
National Security Agency
It's Probably Probable
Learners make predictions and draw conclusions from given information as they learn the meaning of probability in this vocabulary-rich, integrated activity that presents a variety of teaching strategies to motivate and reach...
Curated OER
Activity Plan 3-4: Scrumptious Shapes
Students discover together that shapes are everywhere - even in the food we eat. In this early childhood math and art lesson, students read about shapes, identify foods that match geometric shapes, and create a class book.
EduGAINs
Discovery of Pi
Serve up a slice of math for Pi Day! A combination of fun, hands-on lessons and helpful worksheets encourage learners to practice finding the radius, diameter, and circumference of different circles.
EngageNY
Understanding Box Plots
Scholars apply the concepts of box plots and dot plots to summarize and describe data distributions. They use the data displays to compare sets of data and determine numerical summaries.
EngageNY
Developing a Statistical Project
The 17th lesson in a unit of 22 presents asks the class to conduct a statistics project. Pupils review the first two steps of the process of asking a question and collecting data. They then begin the process by developing a...


